Market Pulse ///
The author uses the VolFix trading and analytics platform.
Main methodology — Volume Analysis / Price Action / Market Profile.
Volume Area / RES / SUP / VWAP / Open Interest / Delta Hist. / Volume Hist. +
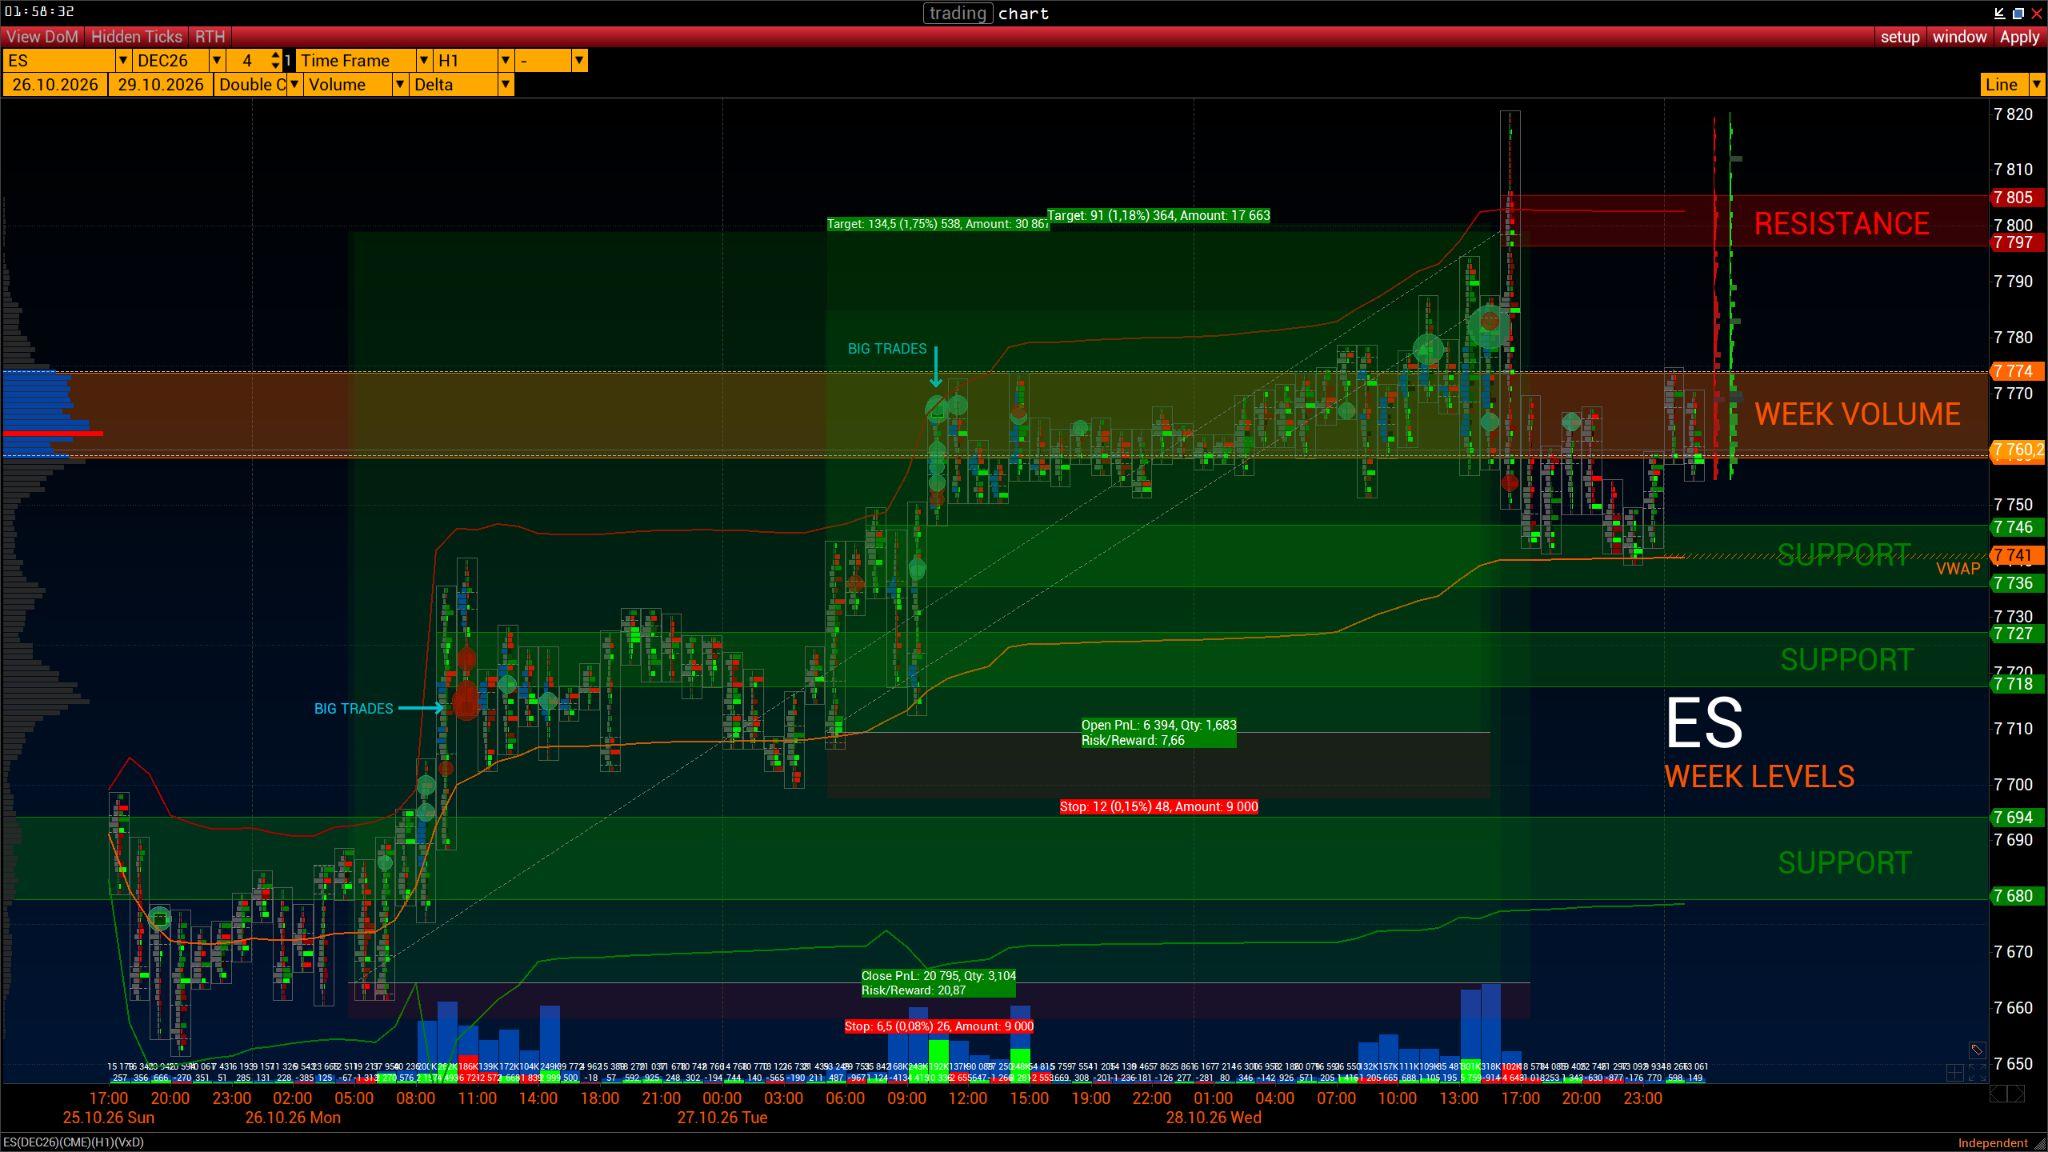
Volume analysis of E-mini S&P 500 for the current week, 26–29 October 2026.
Chart — Timeframe: H1. Double Cluster: volume/delta.
E-mini S&P 500 was generous in the first half of the week to those who firmly believed the uptrend would continue. The gradual rise since Monday was interrupted by the US Federal Reserve’s interest rate announcement. If you missed the announcement, the interest rate was left unchanged at 4.00%.
High volatility at the time of the announcement was accompanied by large trades, marked by green and red circles on the chart.
The current volume-based resistance has formed in the 7797–7805 range. If you are holding a long position, watch for buyers to push the price above this range. If sellers defend this range with aggressive selling, you should at least take some profits and move your stop order to a more appropriate price.
With the ECB’s interest rate announcement due today, 29 October, be prepared for a surge in volatility and protect your trades by adjusting your take-profit and stop orders. If the ECB also leaves its interest rate unchanged, the trend may be expected to continue.
If you plan to enter a trade this week, here are the key levels:
Weekly volume core: 7759–7774
Volume Resistance: 7797–7805
Volume Support:
- 7680–7694
- 7718–7727
- 7736–7746
VWAP indicator: 7741