Market Pulse ///
The author uses the VolFix trading and analytics platform.
Main methodology — Volume Analysis / Price Action / Market Profile.
Volume Area / RES / SUP / VWAP / Open Interest / Delta Hist. / Volume Hist. +
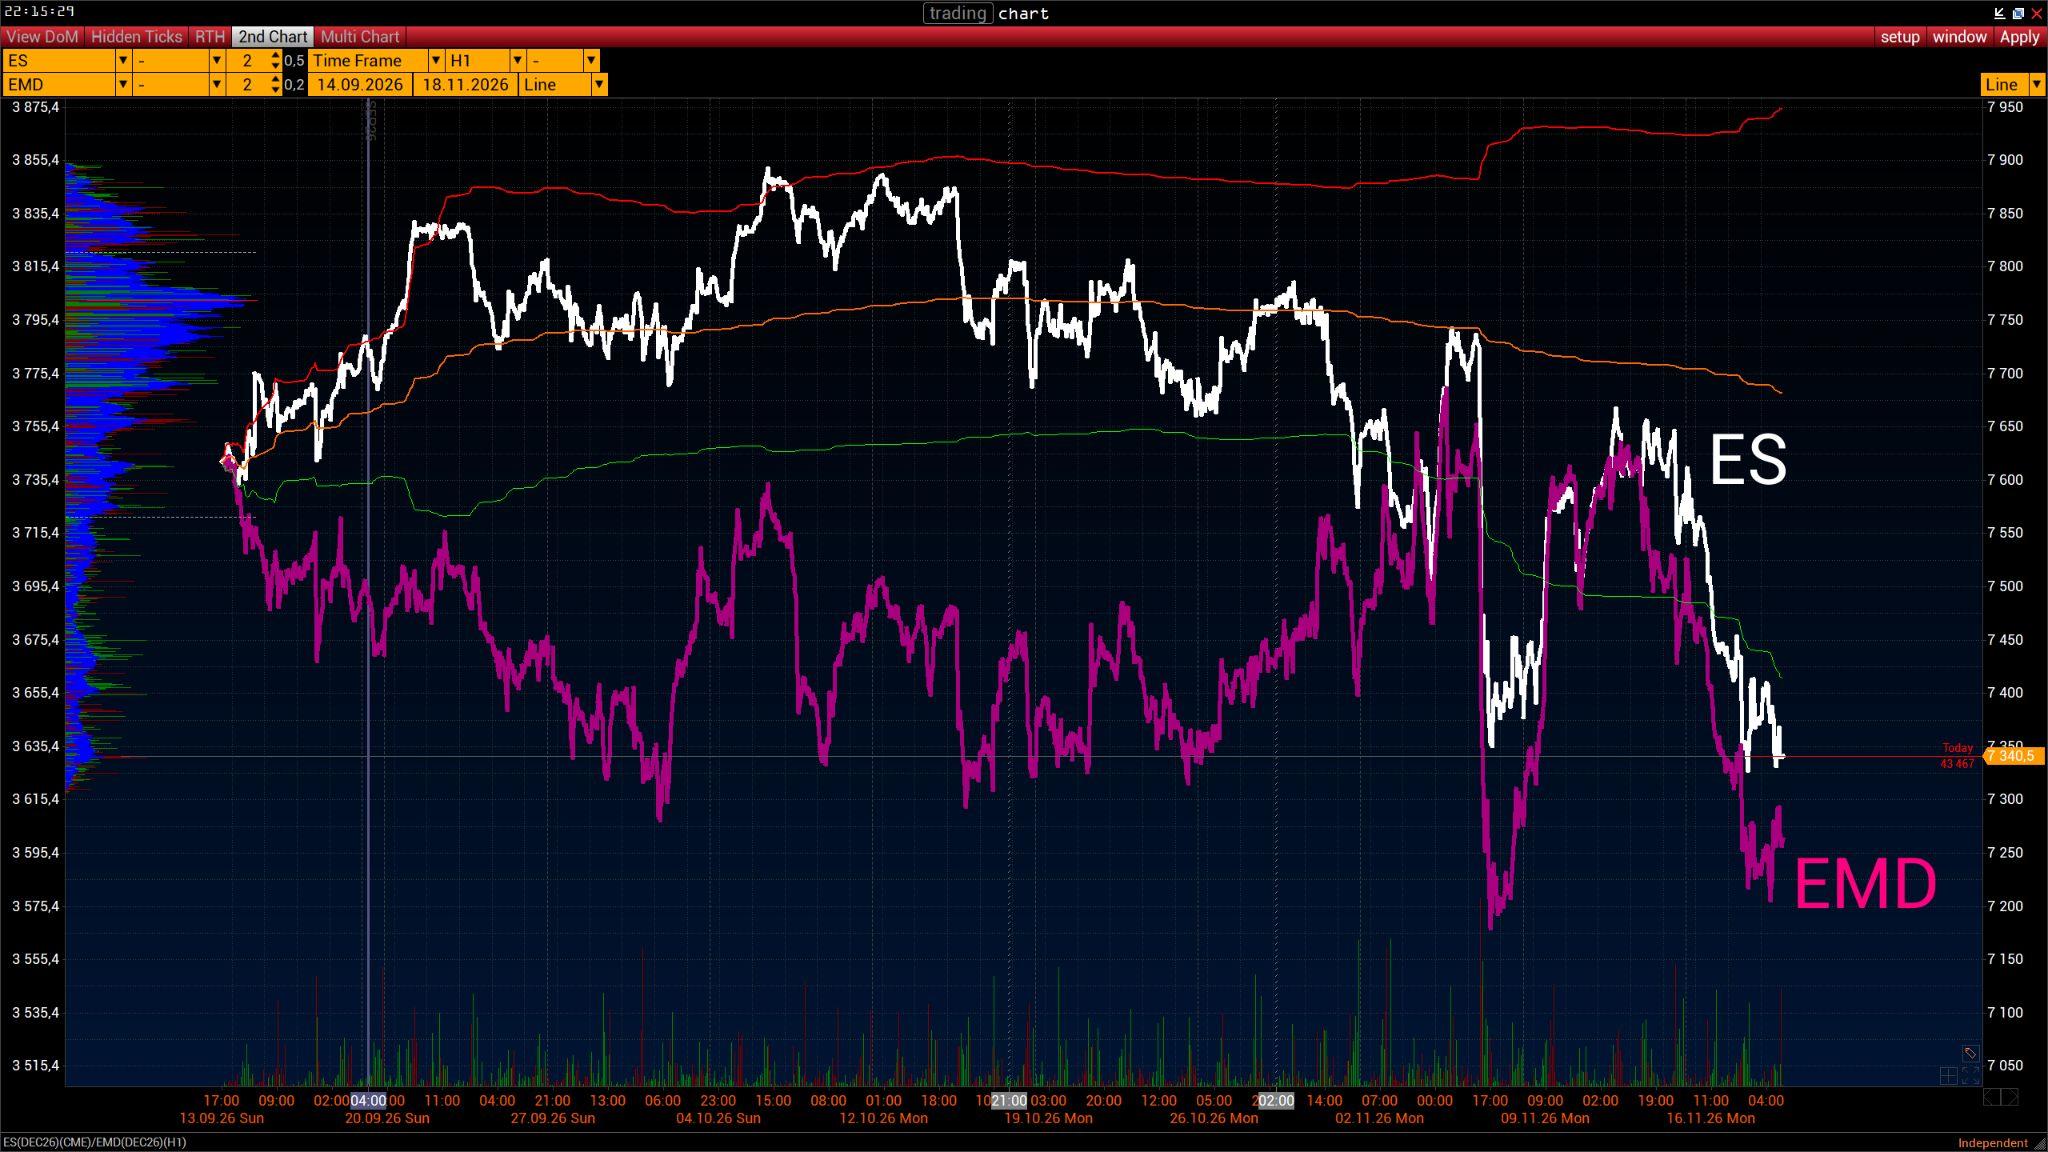
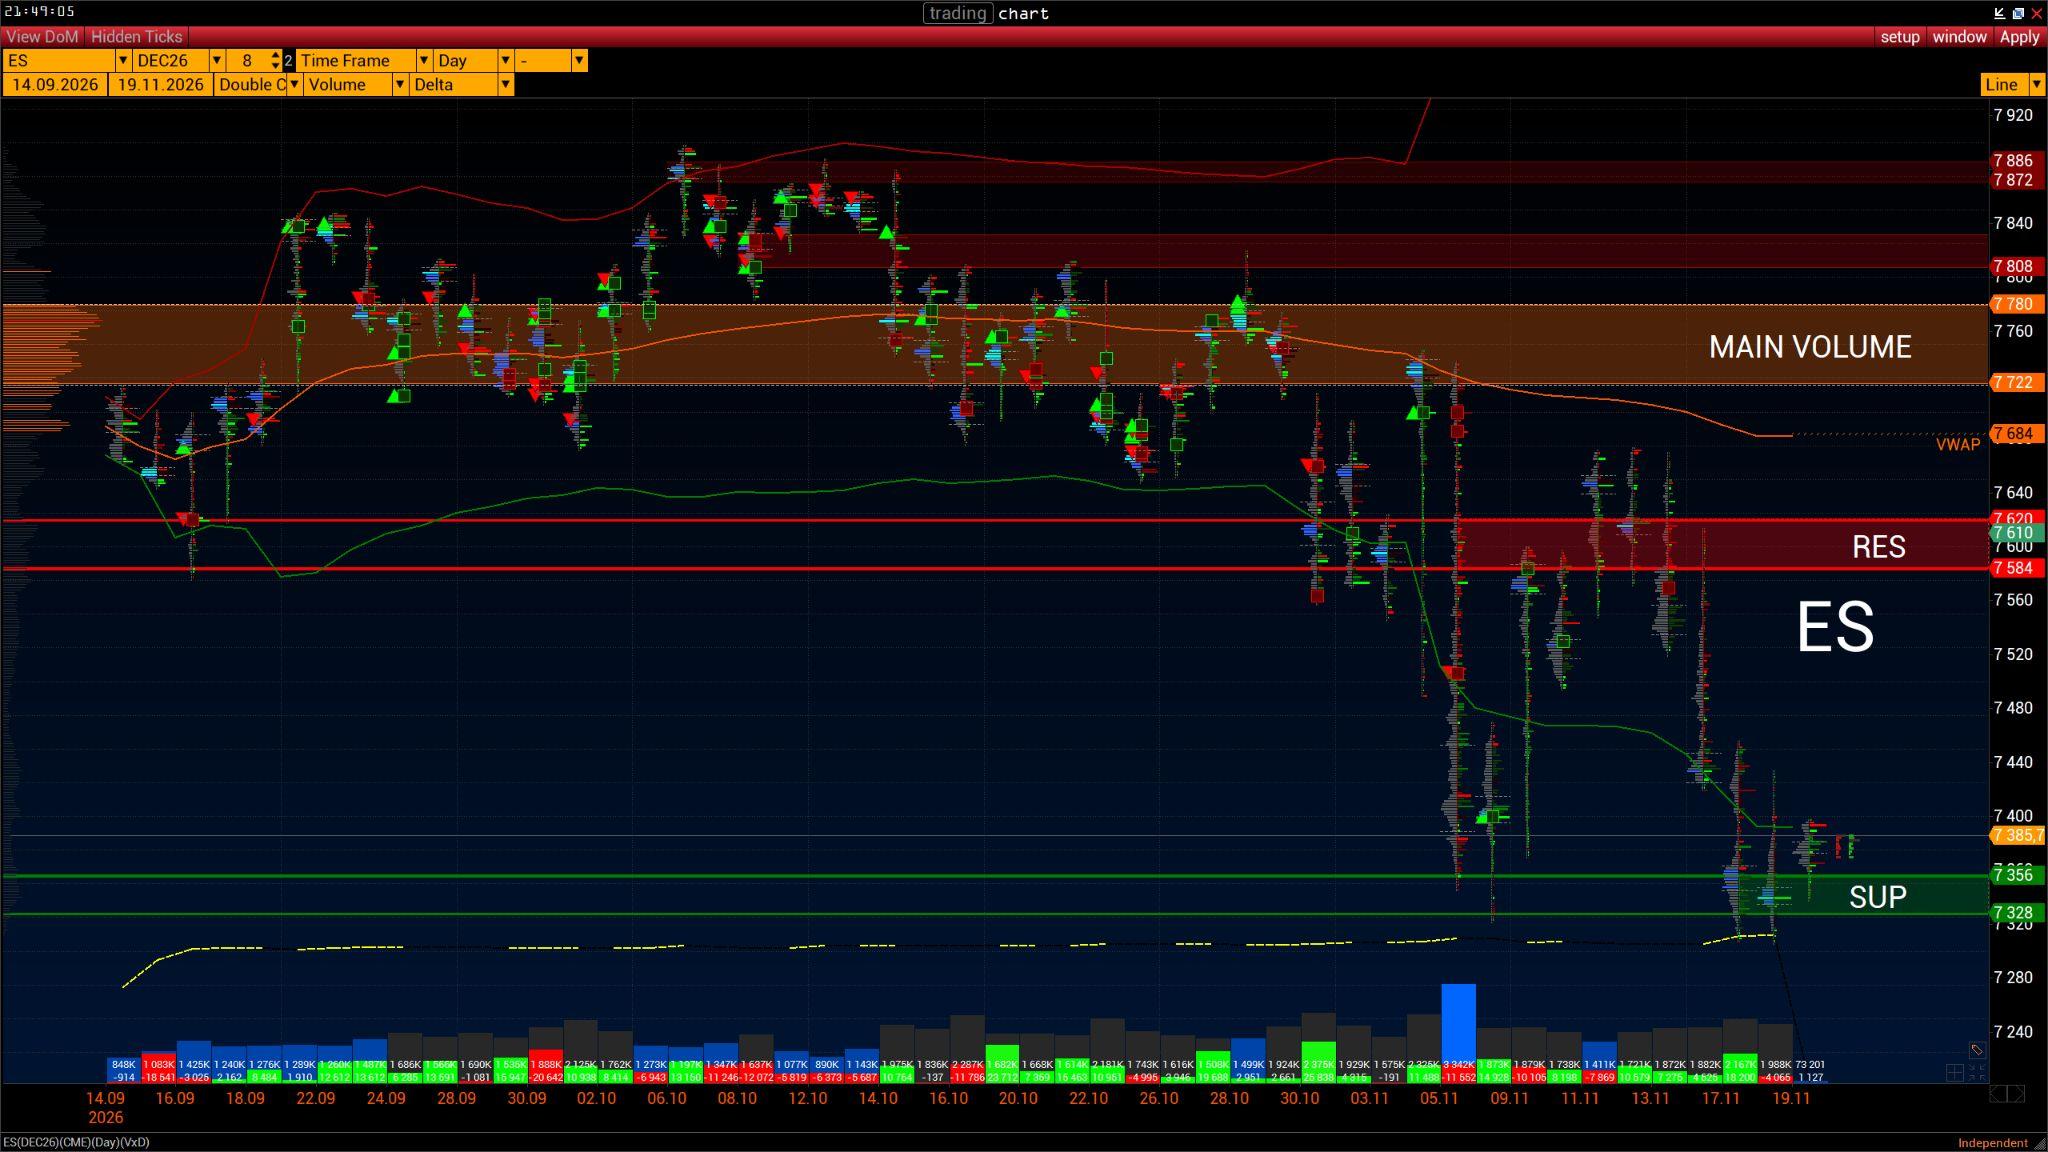
On the daily chart of ES futures (DEC26, CME) covering 14 September–19 November 2026, the market is in a pronounced downtrend after breaking down from a broad distribution zone. The current price of 7385.7 is just above the key support area at 7328–7356. Sellers retain control of the broader market, as price is trading well below VWAP (7684) and the contract’s main volume area, MAIN VOLUME (7722–7780).
Volume, Delta and Open Interest (OI) Analysis
- Signs of absorption in the SUP zone: During the retest of 7328–7356 in the 17–18 November sessions, bursts of positive (green) delta appeared in the lower clusters. The elevated daily volume on the eve of 19 November did not lead to acceptance below 7328. This points to limit buying or widespread profit-taking on short positions around 7330–7360.
- Horizontal profile asymmetry: The cumulative histogram on the left shows a pronounced volume imbalance: most liquidity remains overhead at 7722–7780, while very little trading has taken place between 7400 and 7580. This structure often triggers sharp, rapid rebounds (short squeezes) once price gains acceptance above the local highs of the base.
- Open interest (OI) dynamics: After the initial rise in mid-September (14–22 September), interpreted as rollover-related, the dotted OI line remained stable. During the November decline and the test of SUP, OI did not fall; it stayed elevated with a slight upward slope. This may indicate that the decline involved the opening of new positions, rather than only the closing of longs. OI alone does not establish their direction. New shorts on the breakdown and potential accumulation of longs through limit orders near 7356 remain possible explanations.
Trading Scenarios
- Base scenario — continuation of the downtrend (a break of SUP): With the broader trend and VWAP (7684) pointing down, acceptance below 7328 on a daily closing basis, with rising volume and negative delta, would confirm that demand has been absorbed and open the way for another downward impulse toward 7280–7240.
- Alternative scenario — a technical rebound into the low-volume corridor: If buyers hold the support zone at 7328–7356 and price firmly gains acceptance above 7400 (above the descending green line), with positive delta prevailing, the thin volume profile would favour a rapid move higher, with an initial target of a retest of RES at 7584–7620. As long as price remains below 7620–7684, any rally should be viewed as a correction within a bear market.
Key Price Ranges and Levels
| Zone / Level | Range (ES DEC26) | Volume / Cluster Role |
|---|---|---|
| Upper resistance (highs) | 7872–7886 (intermediate level: 7808) | Boundary of the October top and a price rejection zone. |
| MAIN VOLUME | 7722–7780 | The largest cumulative volume node over the entire period (HVN on the left-hand histogram) — the main price magnet and strategic resistance. |
| VWAP | 7684 | The volume-weighted average price is sloping down, confirming sellers’ dominance over the medium term. |
| RES (Resistance) | 7584–7620 | Key role-reversal resistance that already rejected price during the November rebound. |
| Low-volume corridor (LVN) | ~7400–7580 | A thin profile on the cumulative histogram on the left — an area of “empty space” that price tends to traverse impulsively. |
| Current price | 7385.7 | Price is squeezed between SUP support and the descending lower green deviation line. |
| SUP (Support) | 7328–7356 | A local demand zone at the November lows, where an initial buying response is visible. |