27 October 2026
CLVolume Analysis
The levels were formed over the period from 22 to 27 October 2026.
Read article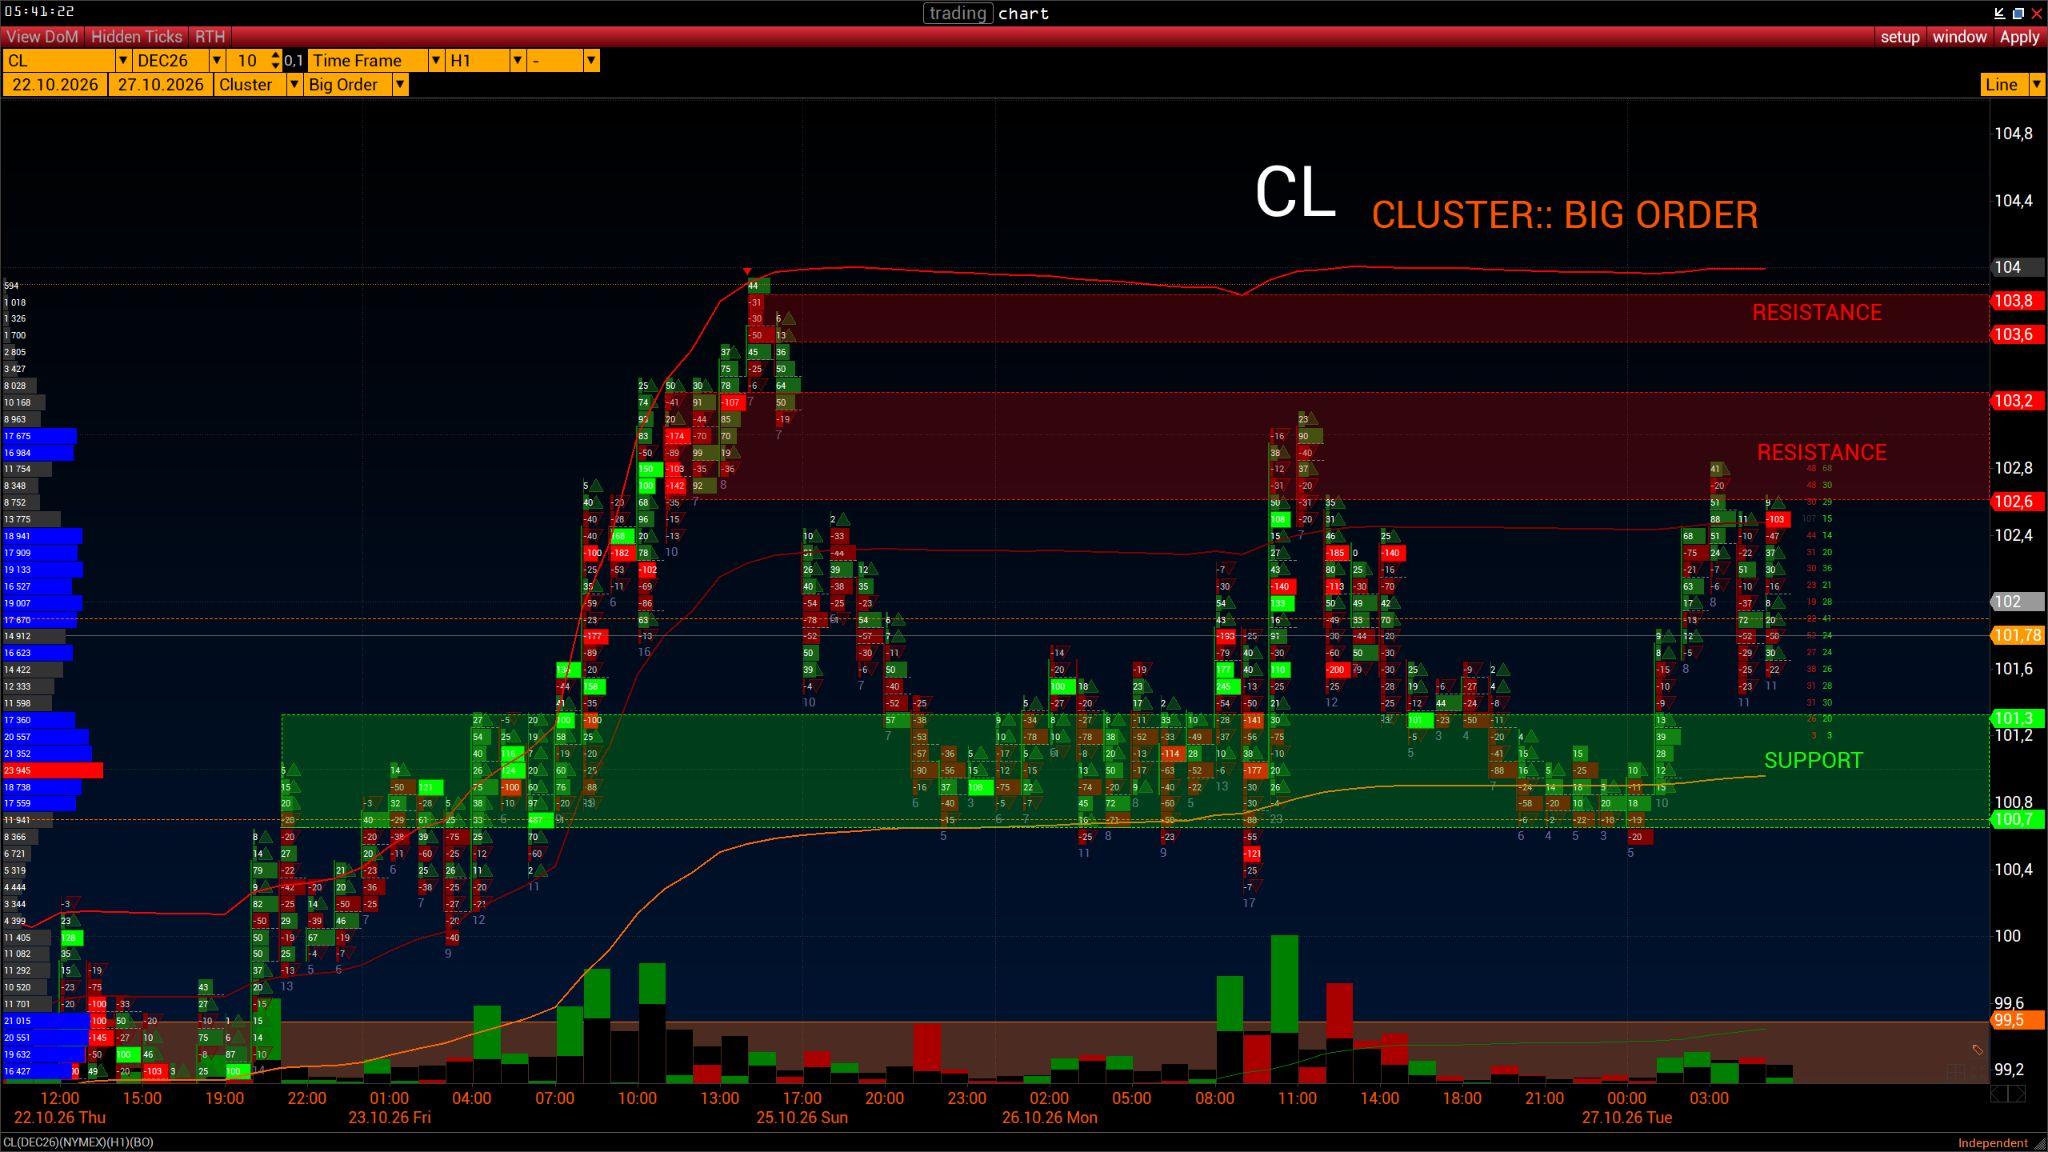

VolFix Journal
Volume, levels and context. A closer look at the markets that matter to you.
After reaching 123.6, FGBL began the expected corrective decline toward the nearest volume support zone at 121.4–121.6.
Read article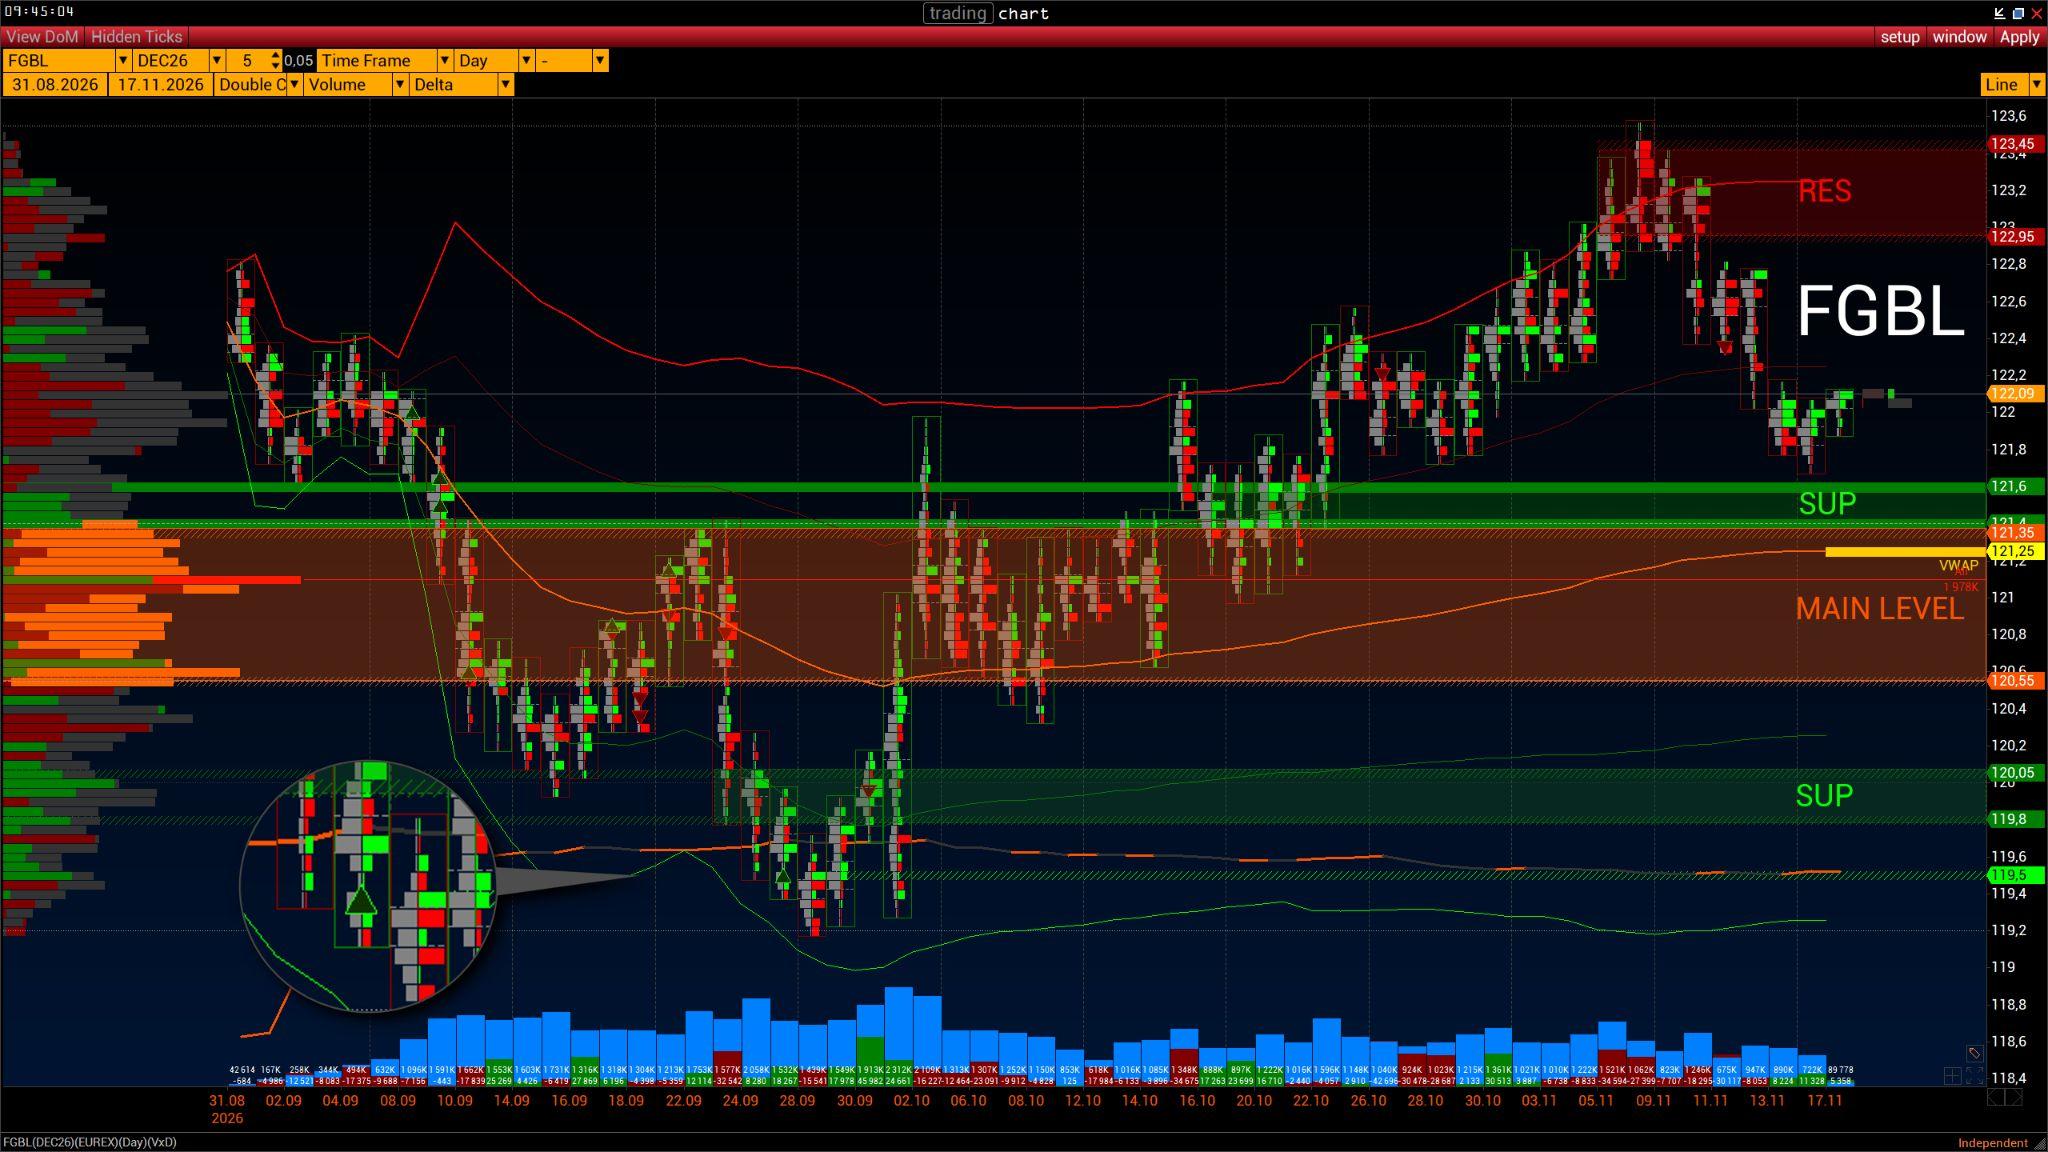
The chart is unavailable. You can still read the full analysis.
Index futures, bonds and currency. Follow the volume across markets.
After reaching 123.6, FGBL began the expected corrective decline toward the nearest volume support zone at 121.4–121.6.
EURO12 November 20269 November. On Monday, traders in the European and US sessions barely managed to push the price from 1.12 to 1.124. Even then, the main impulse came at the close of the US session. It was a routine trading session, but what happened over the following days deserves attention.
10 November. As soon as European exchanges opened, traders, under the slogan “Nothing personal, just business,” pushed the price above the Asian session's range to feast on their fellow traders' stops in the East. Nor could they have found better opposing orders against which to open short positions. Then came a selling nosedive. This established the volume resistance zone at 1.12495–1.12605. Over the course of the European session, the price was pushed below Monday's opening price. With all macro factors keeping the euro in such a pronounced downtrend, as soon as US exchanges woke up, their tireless workers rolled up their sleeves and rushed to sell until the closing bell. Then came silence—or rather, sideways trading until the next day.
FESX remains in a downtrend, with the price effectively at the contract lows, in the 6100–6128 support range. Daily trading volume this week is close to average levels. This suggests that major market participants remain in a wait-and-see position, likely because of the events mentioned above.
Over 4 weeks, the FESX contract's volume core has formed in the 6184–6232 range. This range should be used as an indicator of a trend change. While the price trades below the volume core, sellers control the market. Once buyers manage to push the price above this range and hold it there, we can speak of upward momentum.
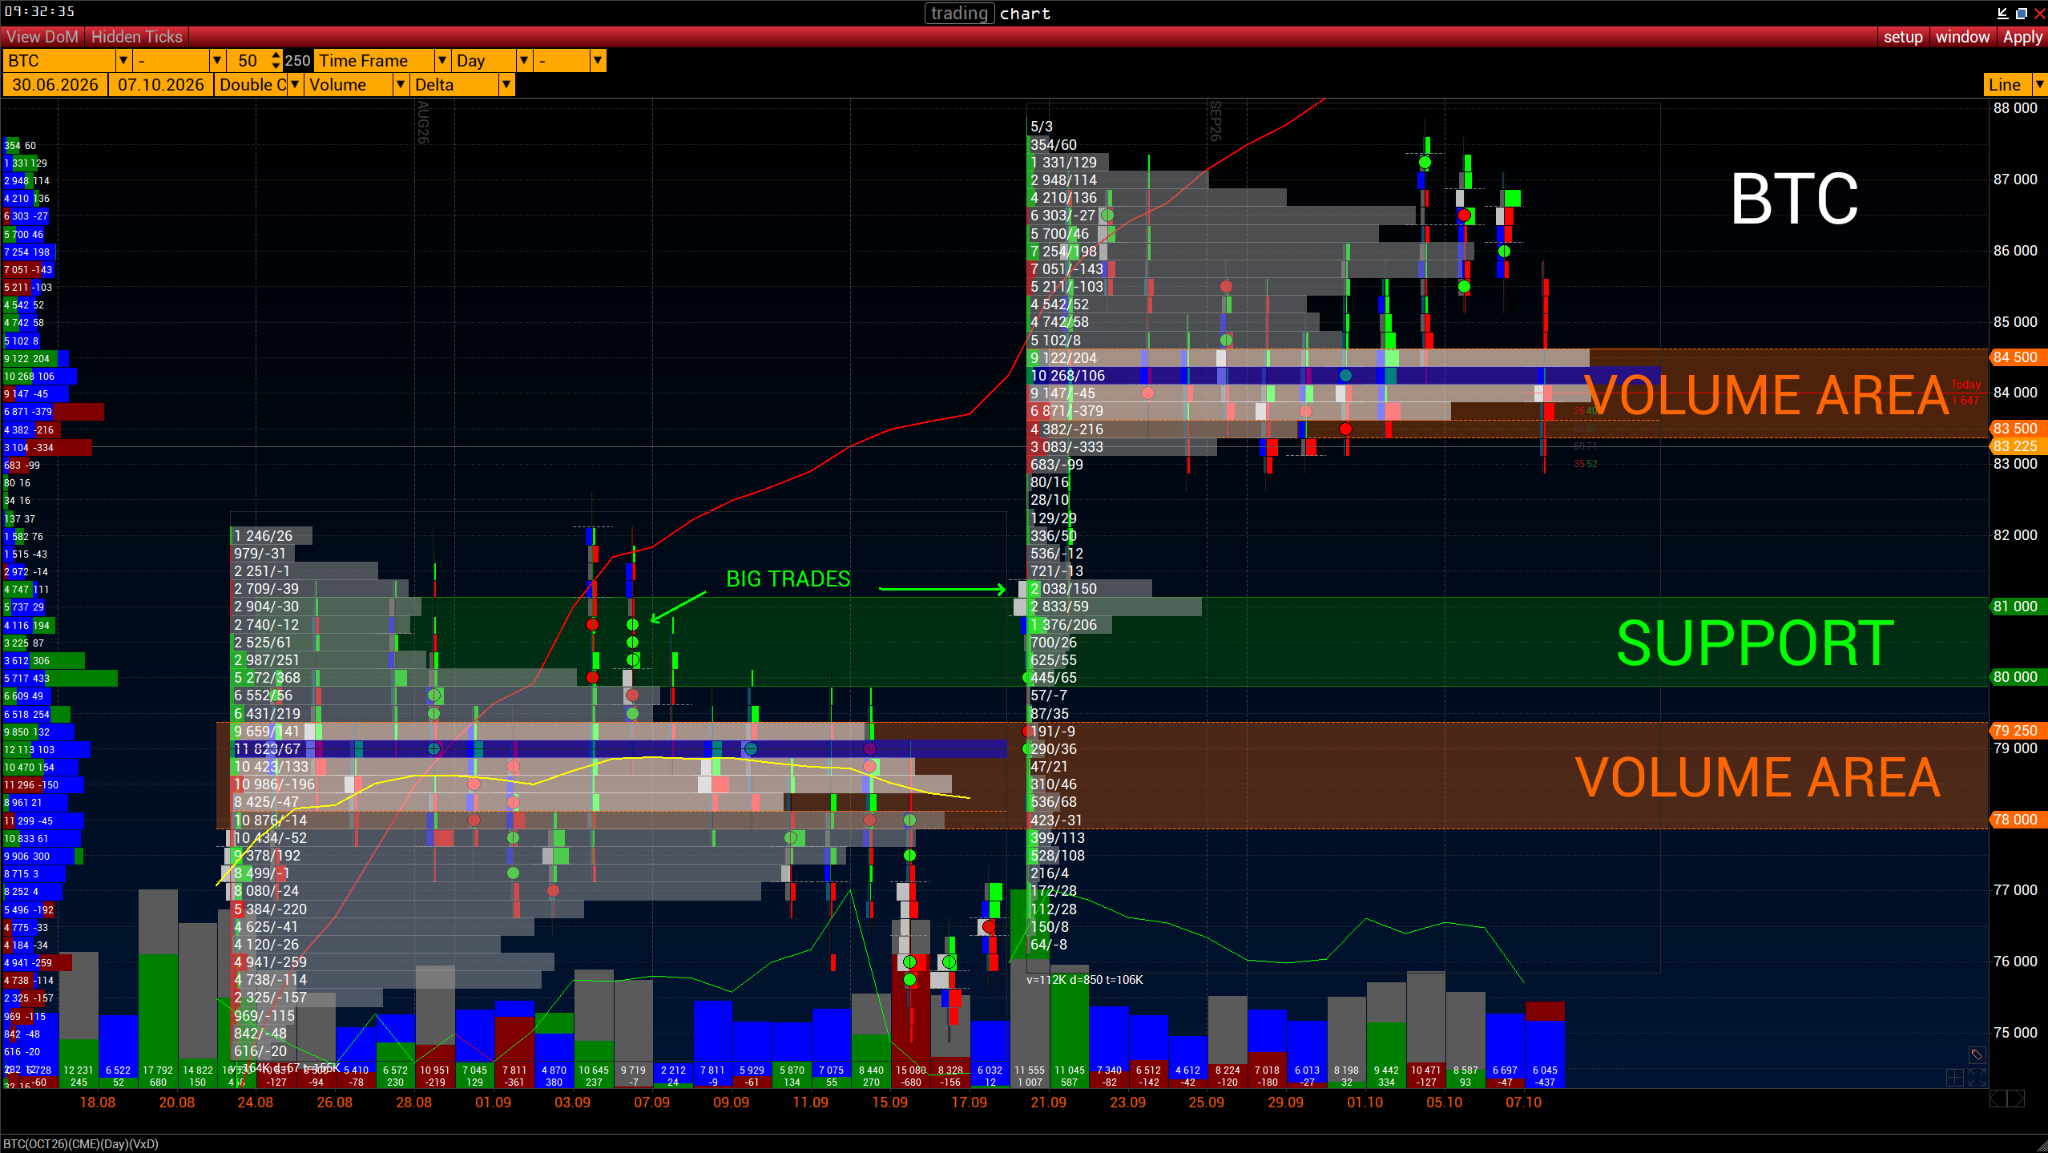
Crude oil and Bitcoin CME. Volume areas, support and resistance.
The levels were formed over the period from 22 to 27 October 2026.
Read articleBTC CME — the price reaching 88.000 apparently did not greatly alarm buyers, as trading volume confirms. It is worth noting the volume level from 83500 to 84500, formed immediately after the breakout above the previous high.
The second most significant volume range formed between 78000 and 79250.