Market Pulse ///
The author uses the VolFix trading and analytics platform.
Main methodology — Volume Analysis / Price Action / Market Profile.
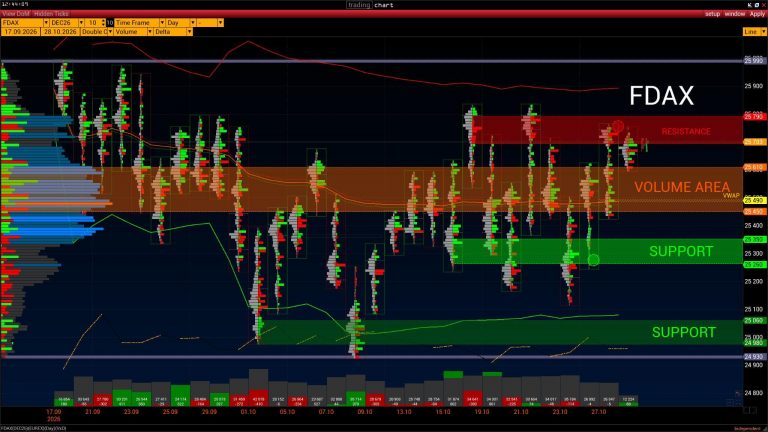
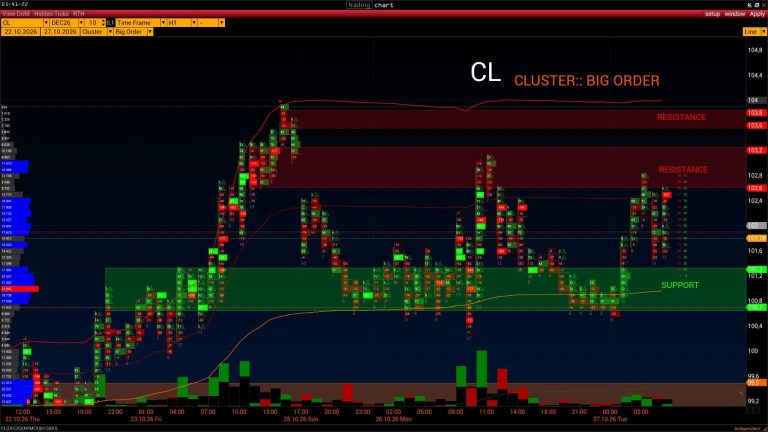
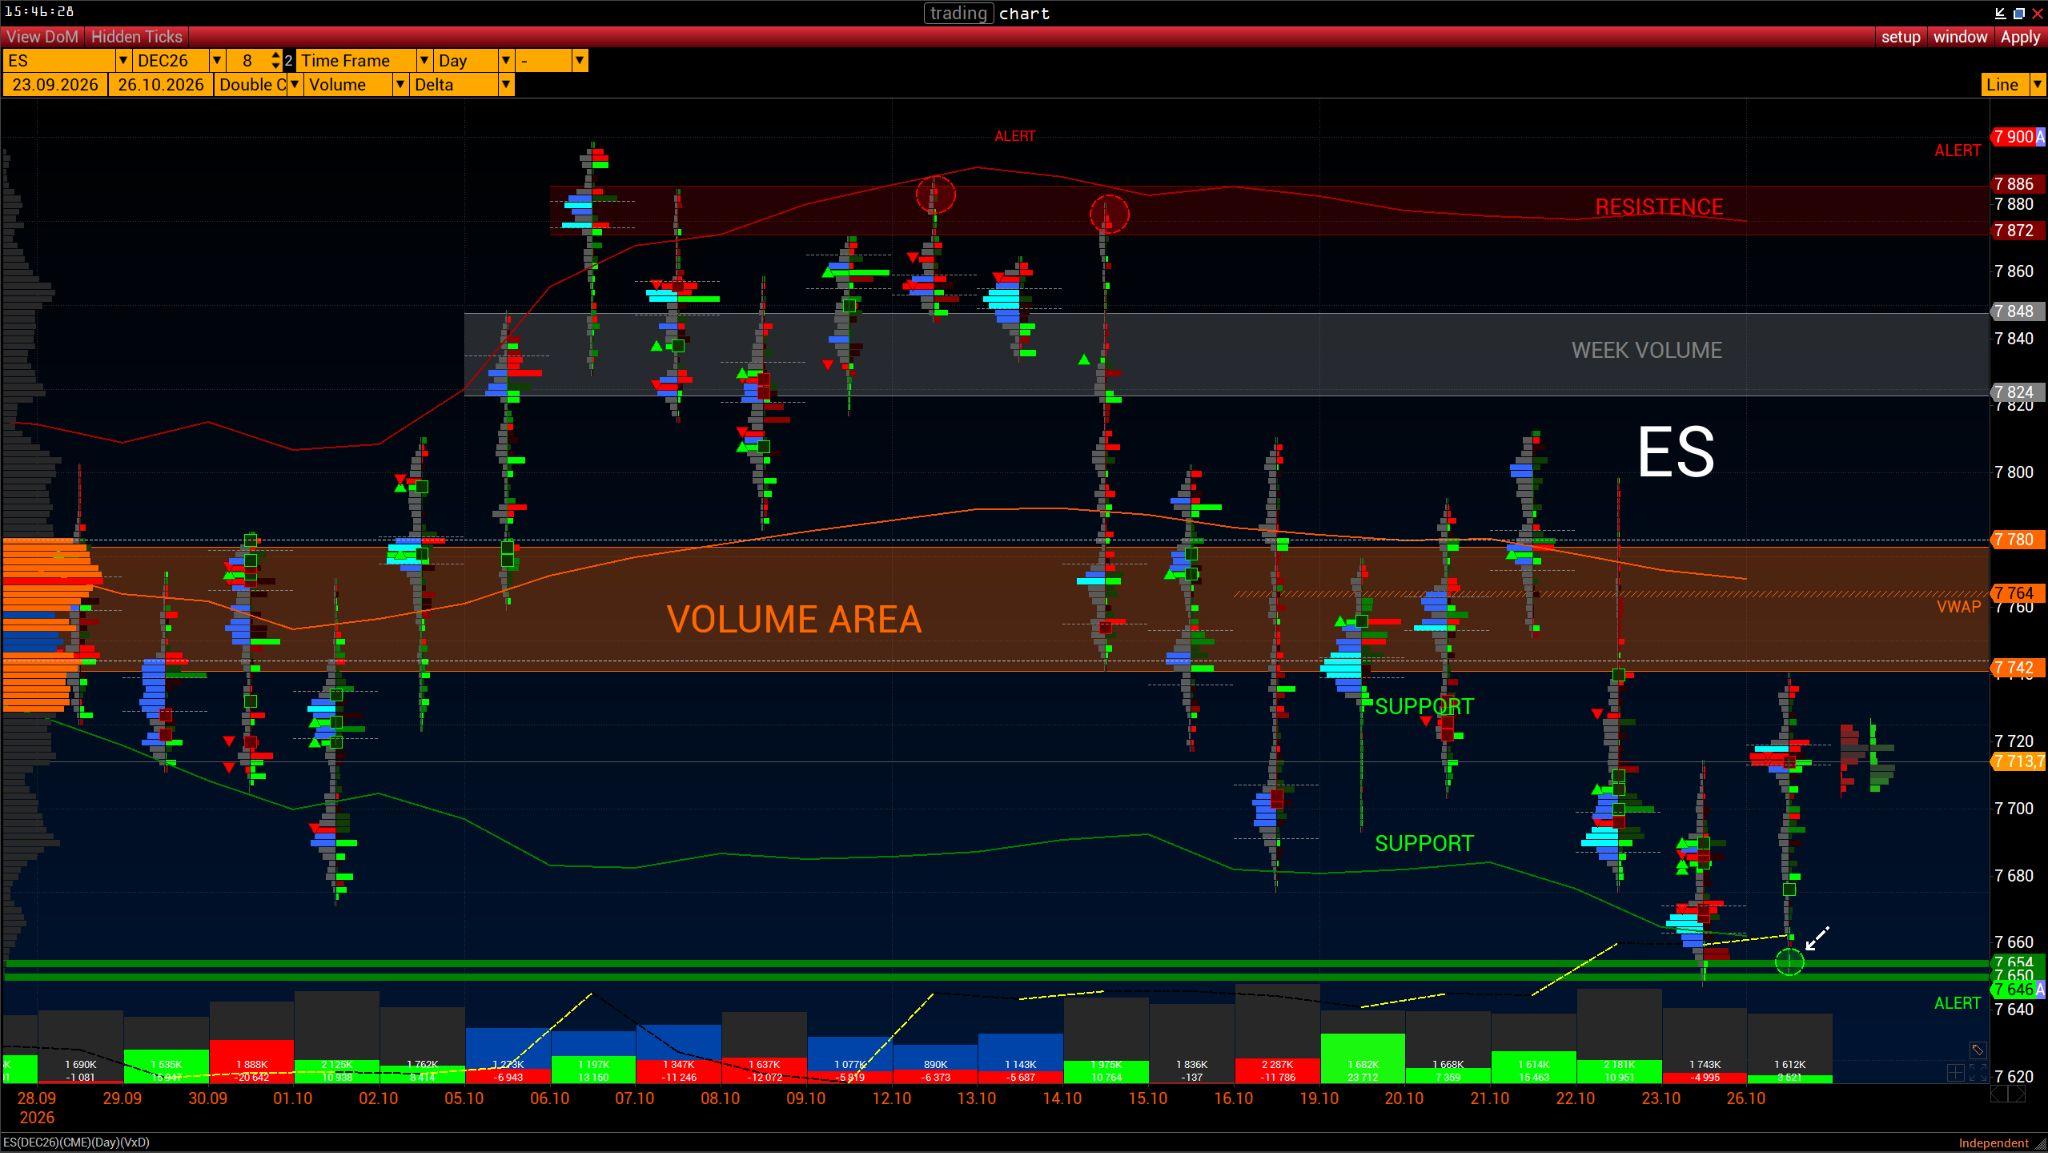
Volume Area / RES / SUP / VWAP / Open Interest / Delta Hist. / Volume Hist. +
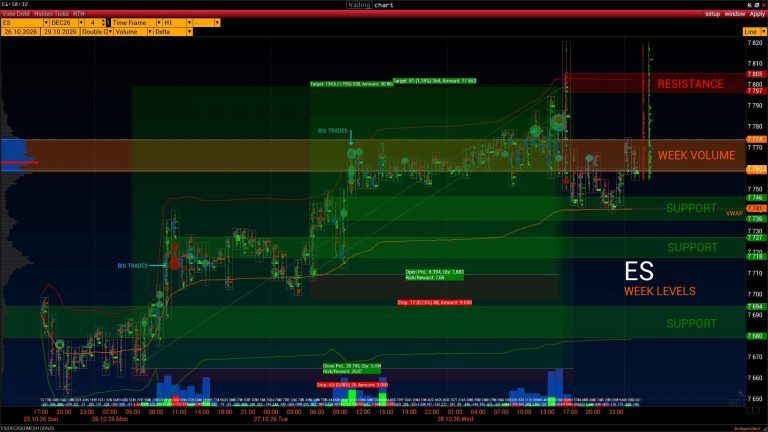
Over the past week, open interest in E-mini S&P 500 reached its highest level for the current contract. Moreover, open interest continued to rise during every down session. The Total Delta readings in the lower histograms suggest that buyers are keen to buy the index at the lowest possible price.
Let us take a closer look at the trading session on 26 October 2026 and how buyers actively defended the support established on Friday, as shown in the hourly chart.
Friday’s core volume range (Friday Main Volume): 7663.25–7670.
Support Level: 7658.50–7662.25. The chart marks three points where buyers showed strong interest in this range and maintained control over price.
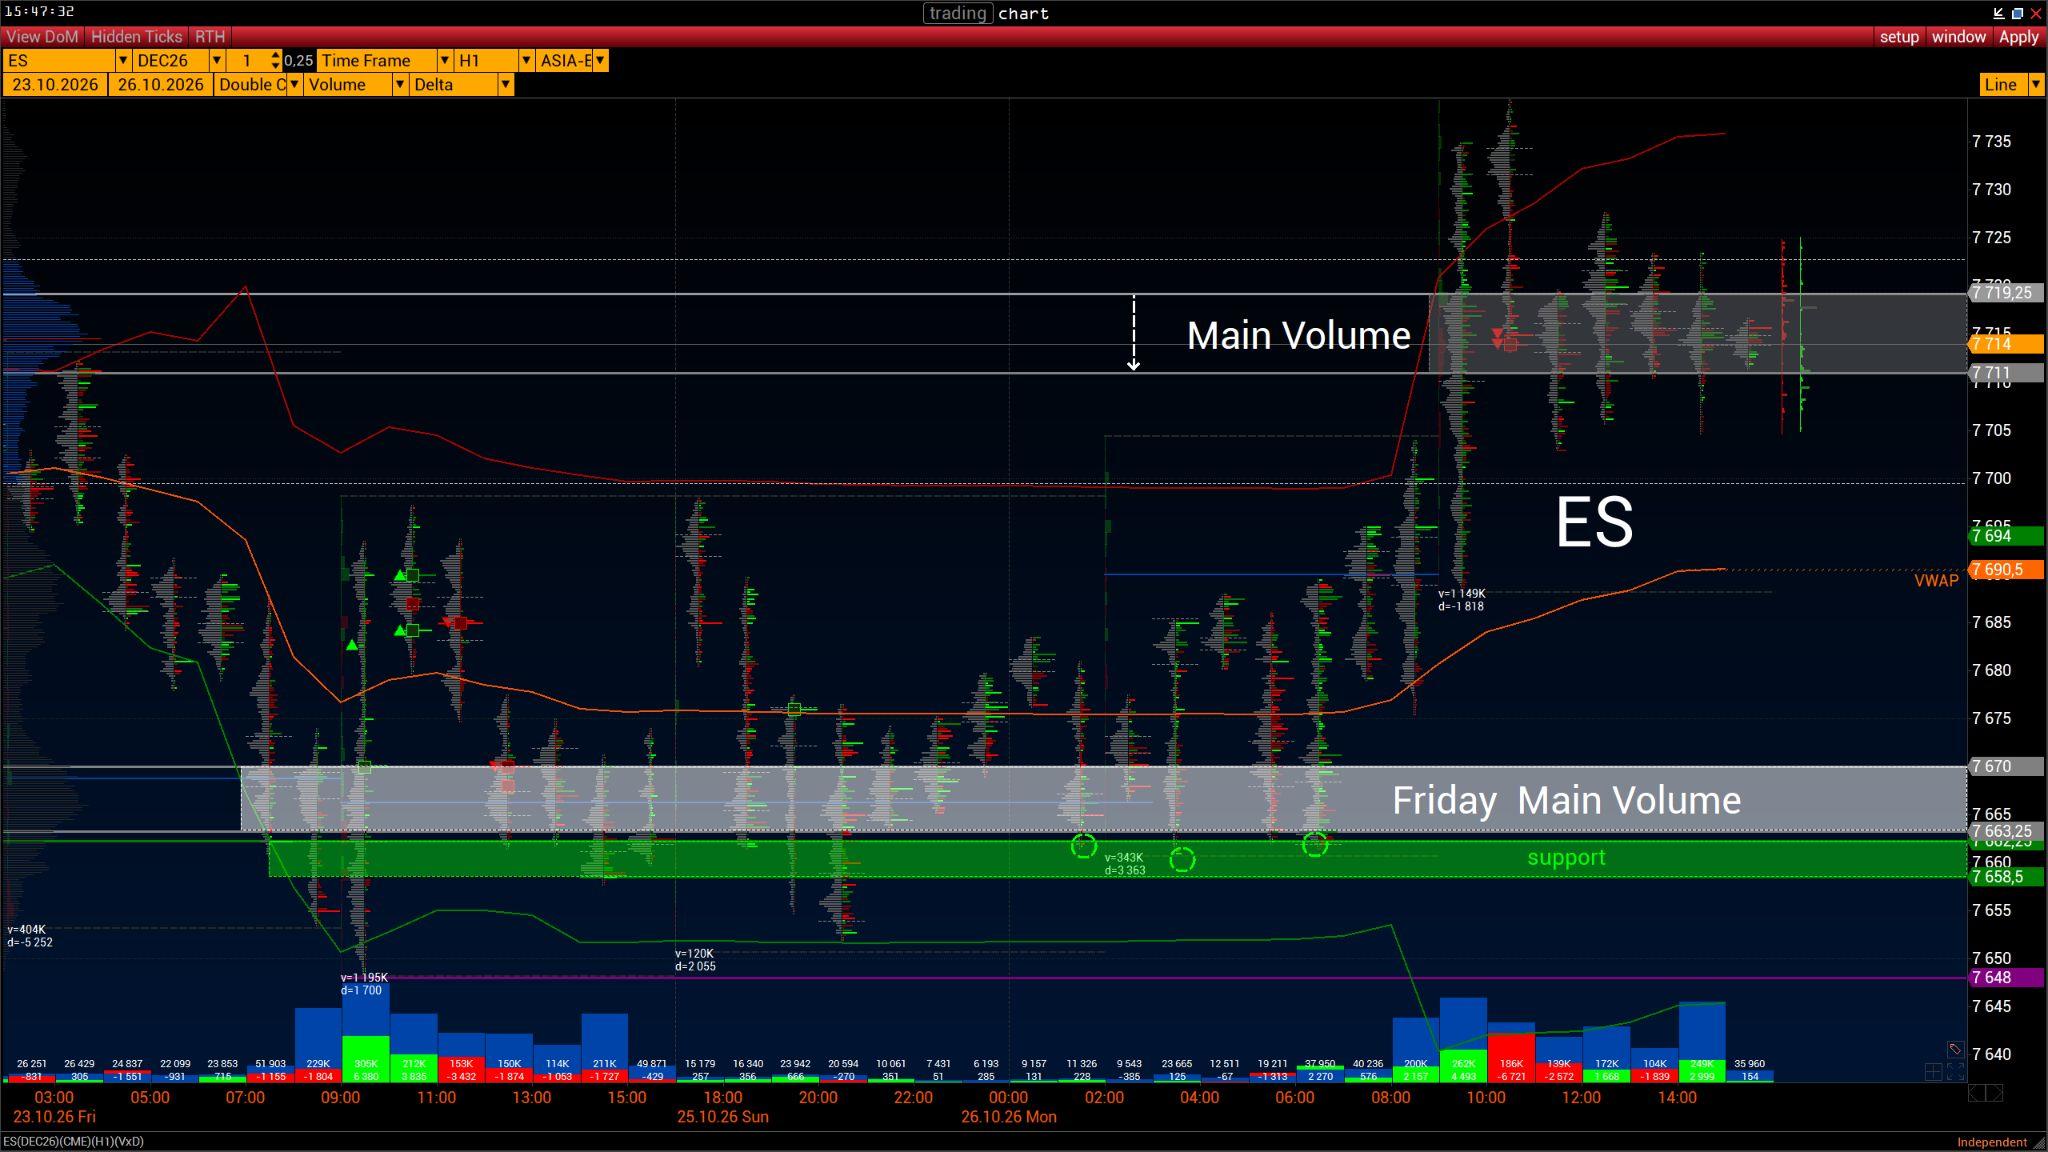
Monday Volume Level: 7711–7719.25.
Friday + Monday VWAP: 7690.50.