Market Pulse ///
The author uses the VolFix trading and analytics platform.
Main methodology — Volume Analysis / Price Action / Market Profile.
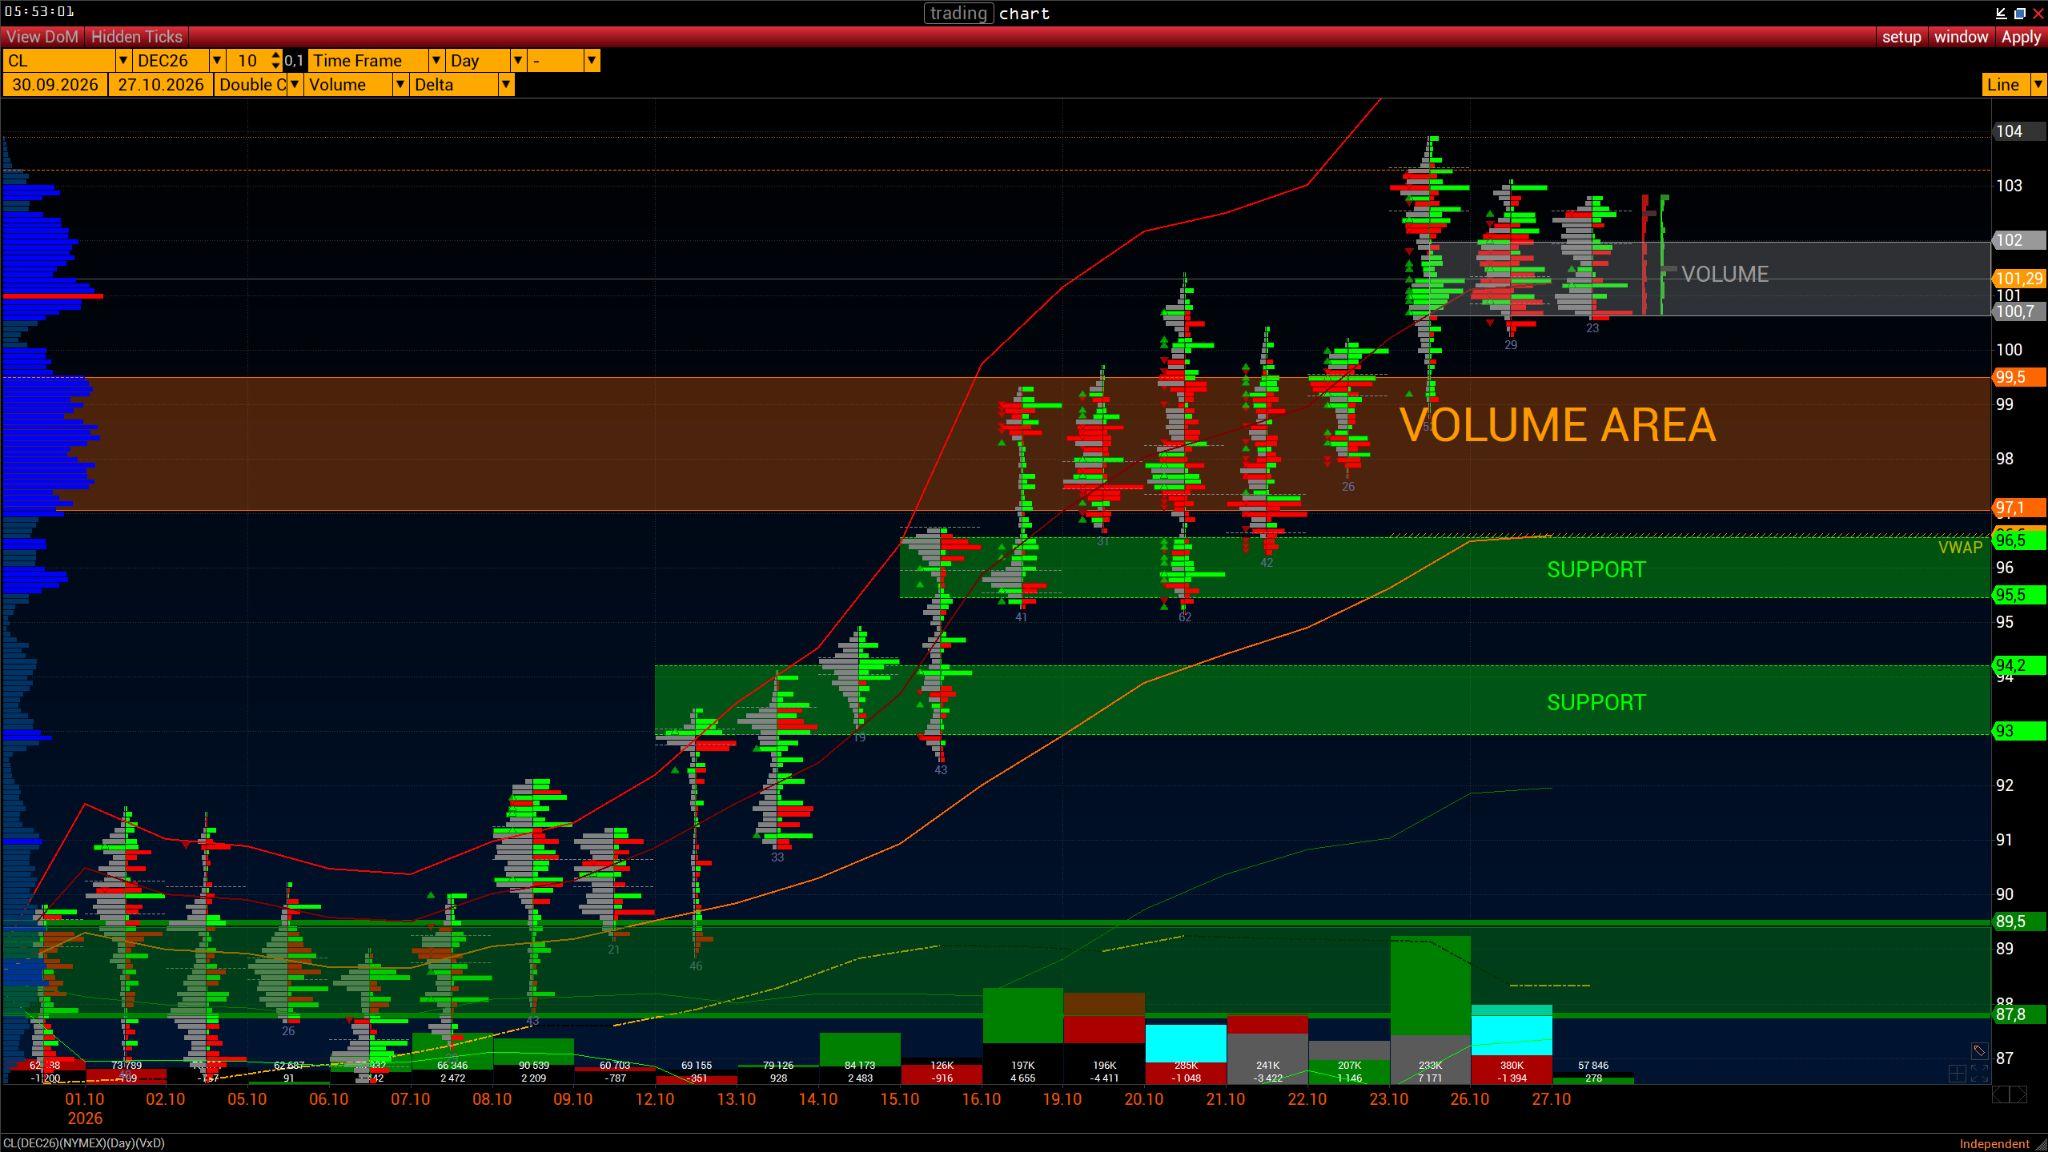
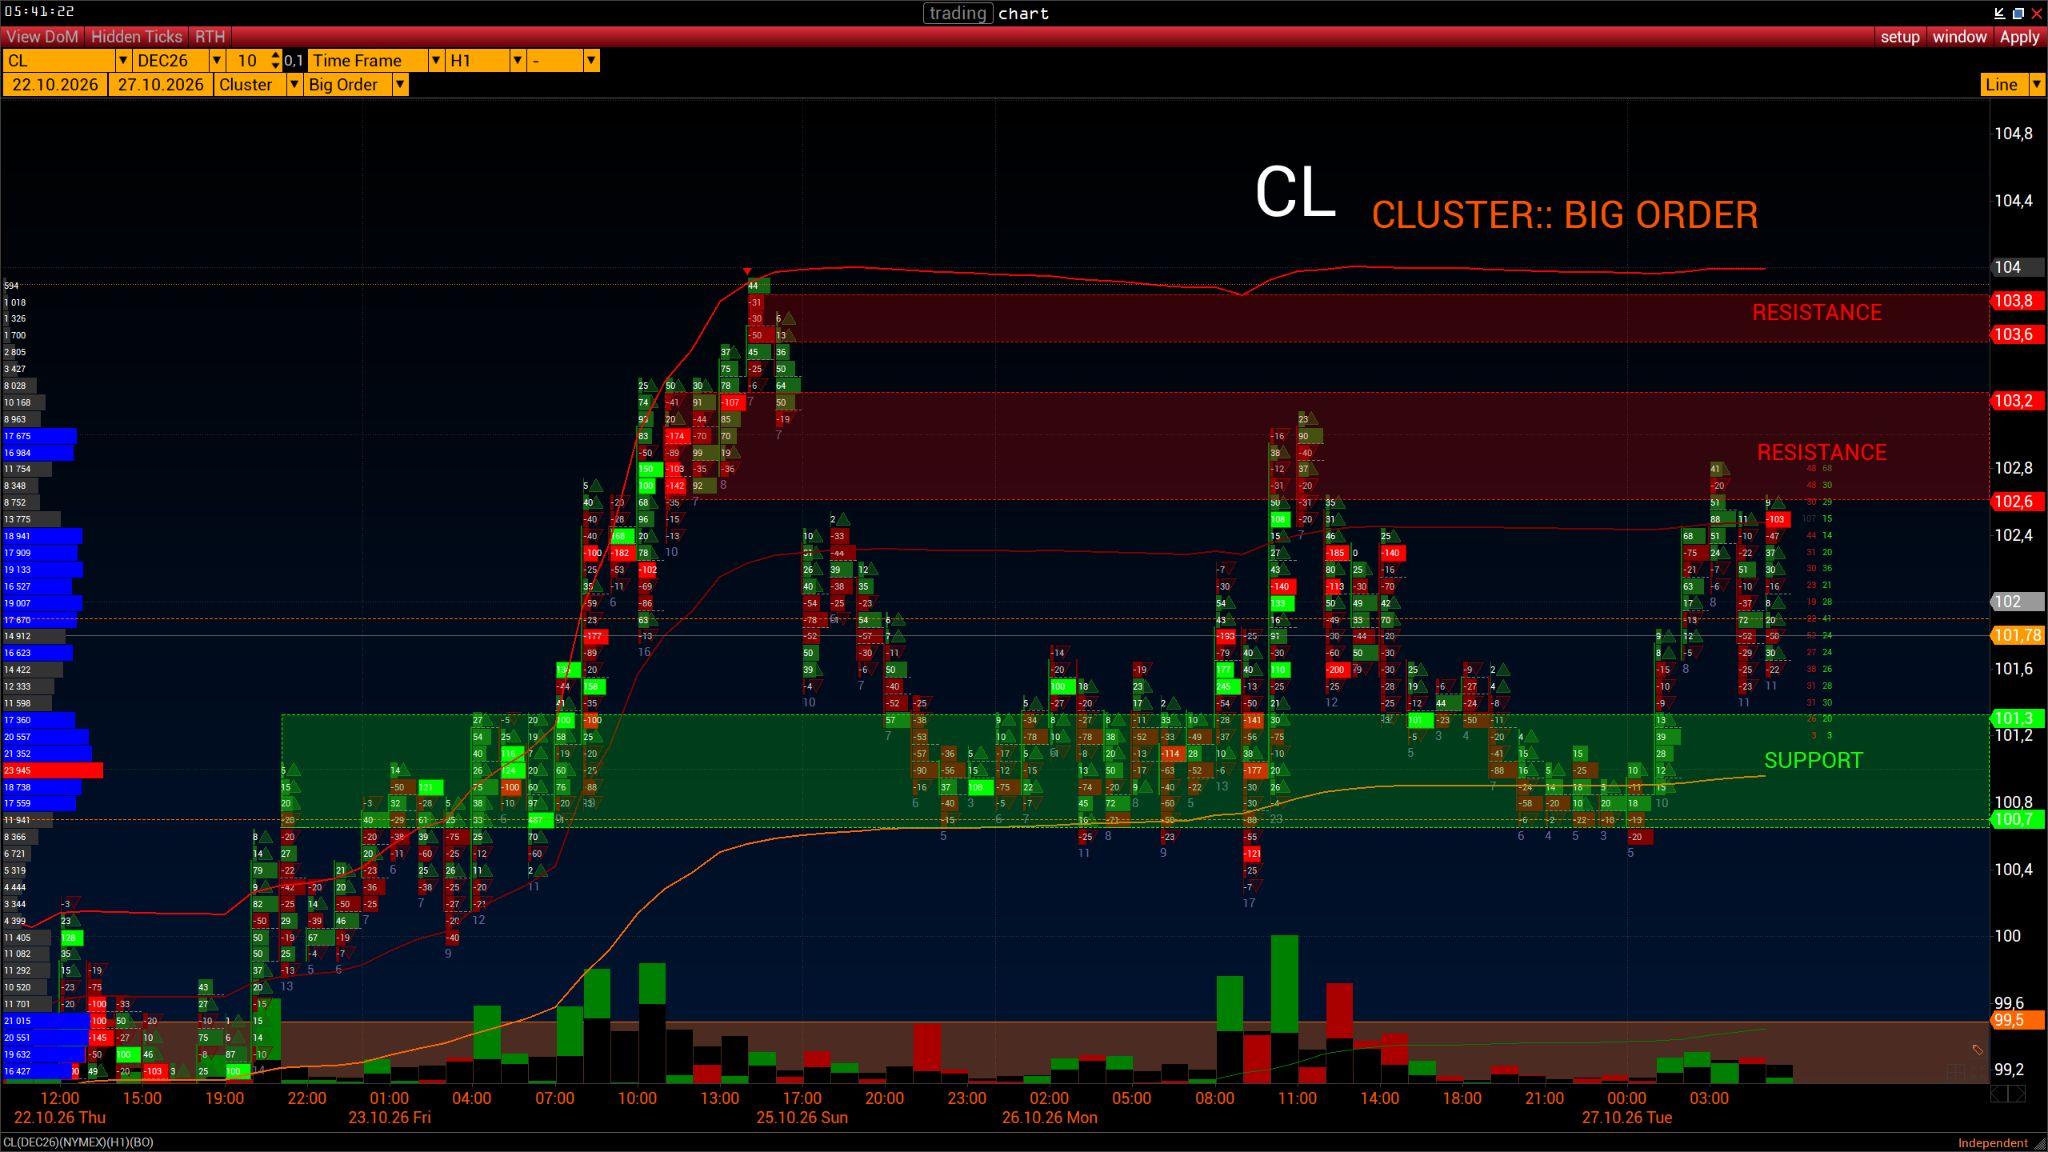
A review of volume-based support and resistance levels for the CL futures contract — 27 October 2026.
The levels were formed over the period from 22 to 27 October 2026.
The chart highlights key volume-based support and resistance levels relevant for 27 October and possibly the following day.
The cluster chart displays Big Order data. We have marked concentrations of large orders to identify levels where major traders are likely to provide support or resistance.
Bear in mind that these levels should be assessed over time: the older a level, the less reliable it is. A level formed today is more reliable and relevant.
Like most markets, CL has adopted a wait-and-see stance ahead of interest-rate news from the US and the EU.
Support: 100.7–101.27.
Resistance: 102.6–103.2 and 103.6–103.8.