01
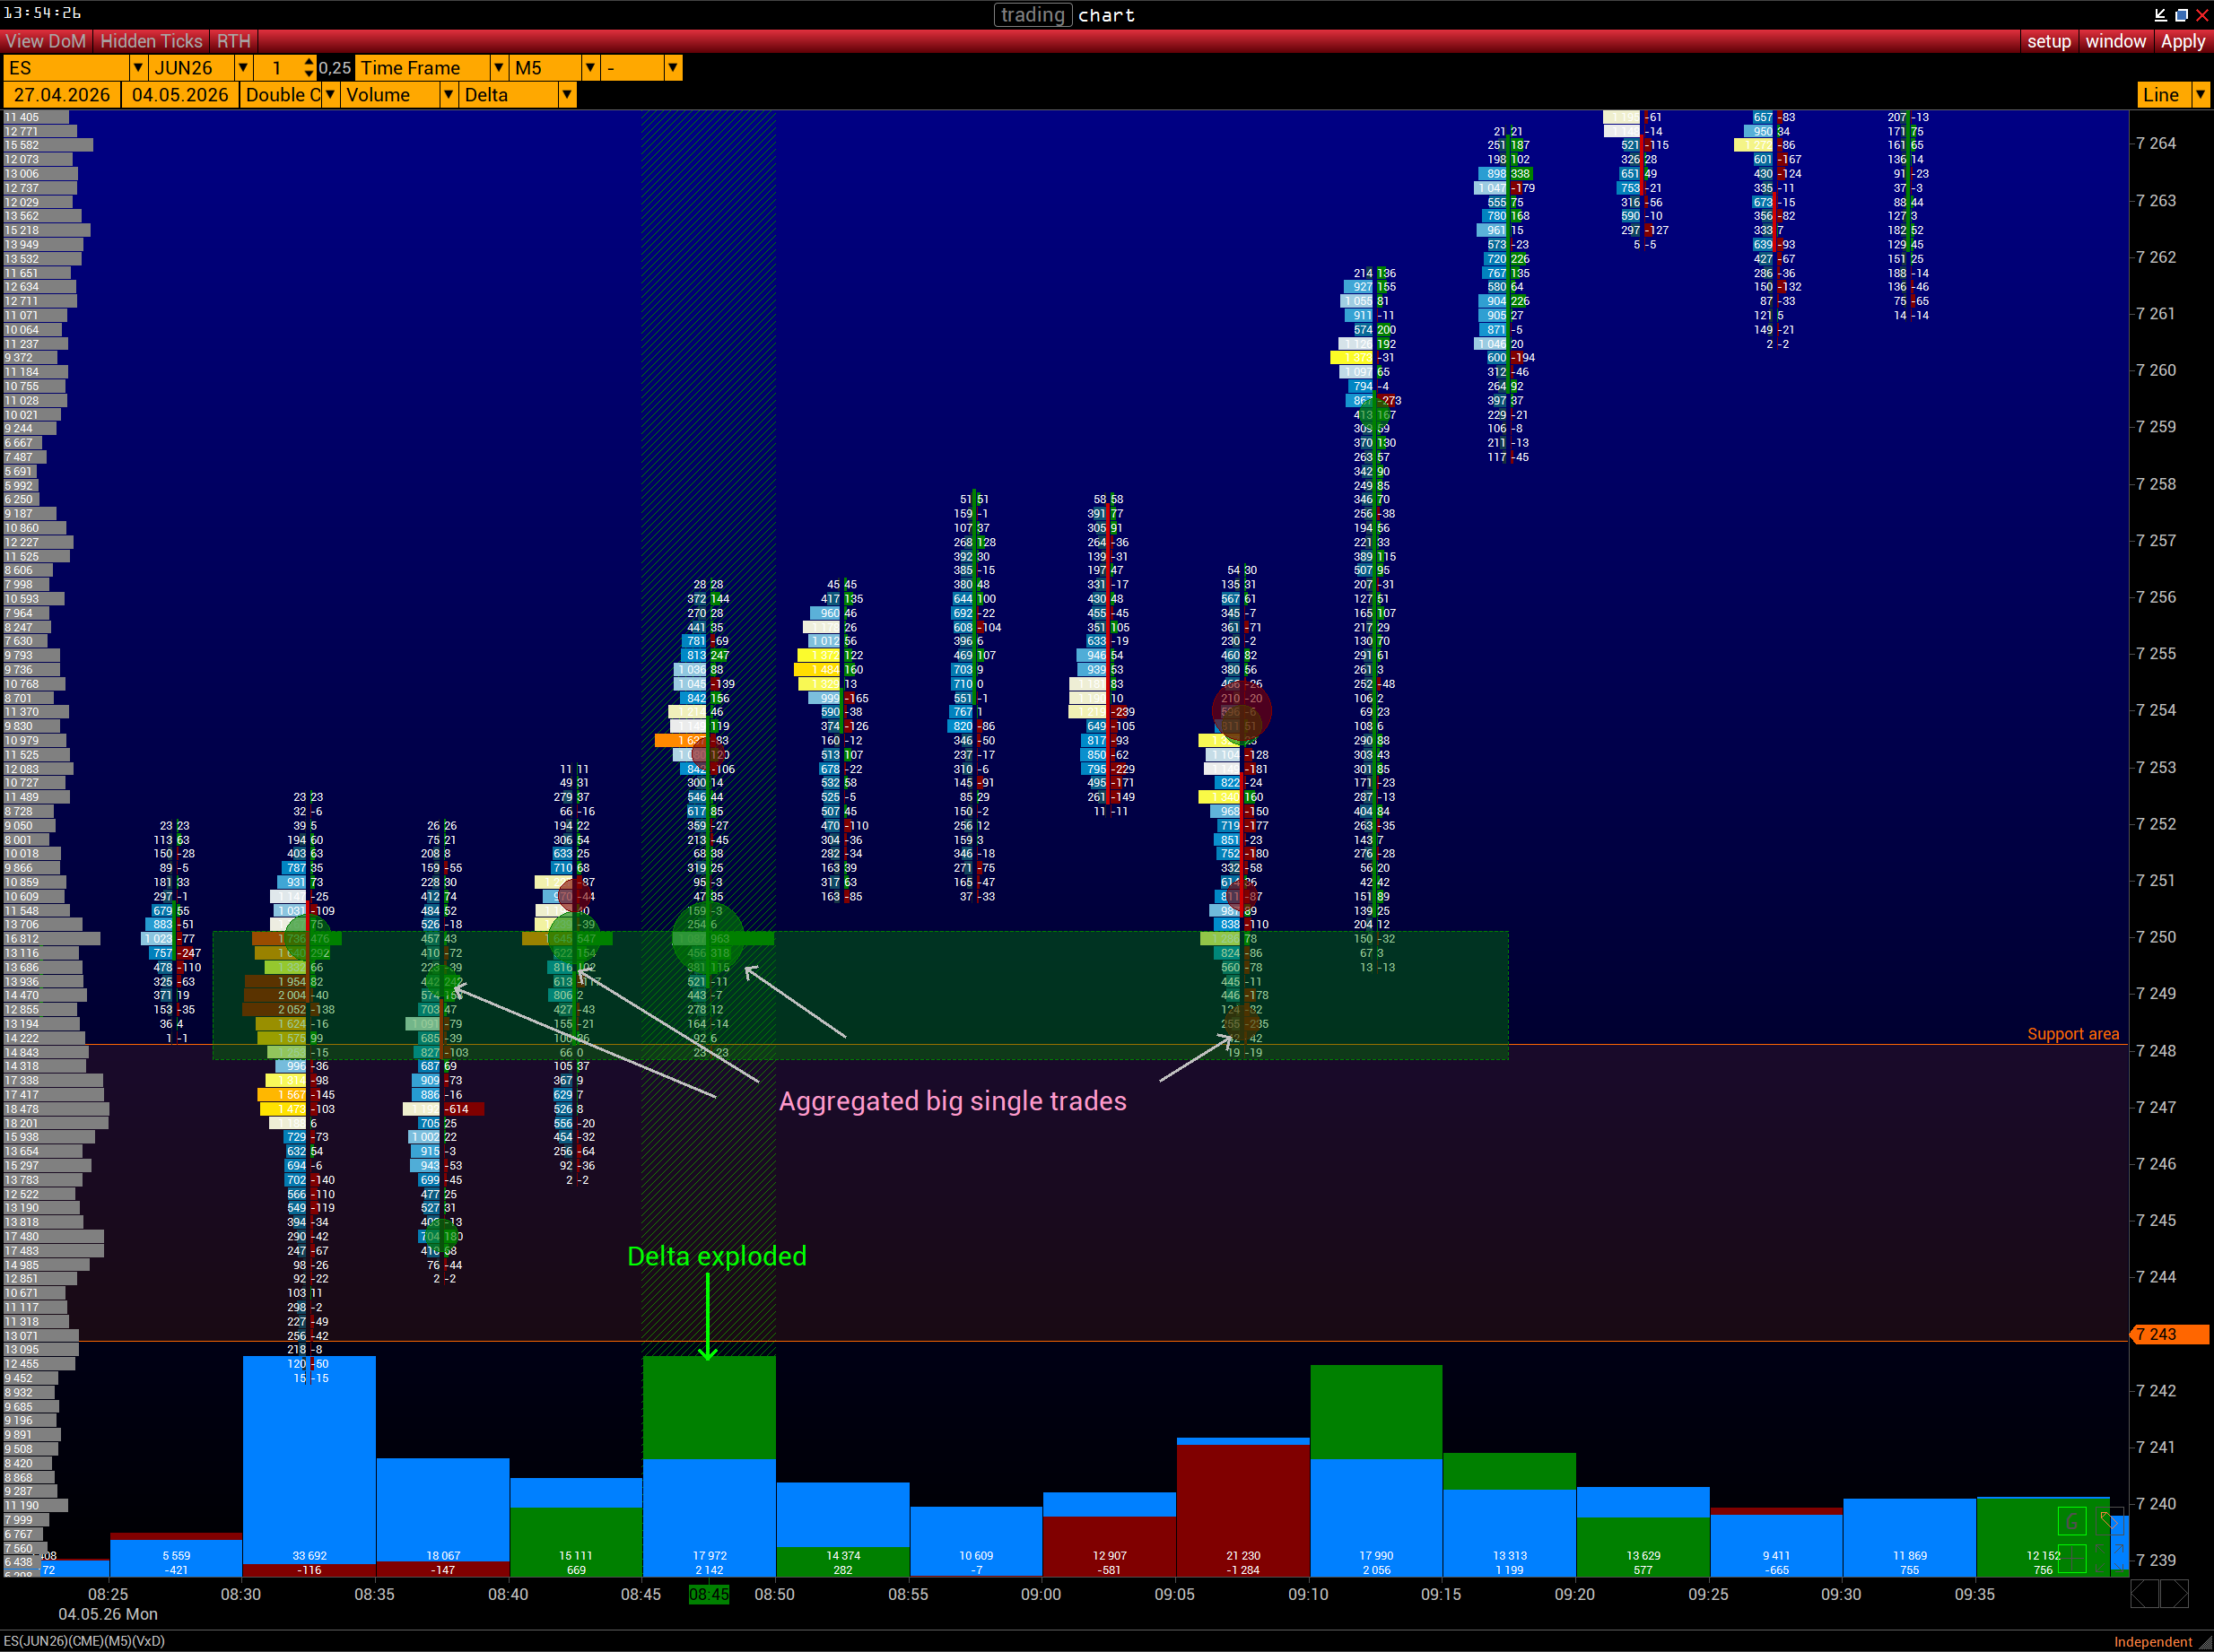
Big Trades
Recognise significant activity
VolFix detects and aggregates related aggressive executions, presenting fragmented activity as a clearer consolidated structure.
2006—2026
For twenty years, VolFix has delivered the tools serious traders rely on—session after session.
New users50% off a 3-month VolFix license
Everyone25% off any other VolFix plan
Chapter 01 / The journey
Since August 2006, VolFix has helped traders turn complex market activity into a clearer view of participation, imbalance and liquidity.
Europe’s firsttrading platform built around volume analysis.
Trader-focusedbuilt around real market-analysis workflows.
20 yearsof continuous development.
Chapter 02 / Philosophy
See what built the move.
A traditional chart shows the result: open, high, low and close. But every candle contains far more information—aggressive buying and selling, concentrations of volume, changing liquidity, imbalances and the activity of larger market participants.
VolFix transforms that data into clear visual structures, helping traders examine what is happening inside the market—not only where the price ended up.
Chapter 03 / Inside the data
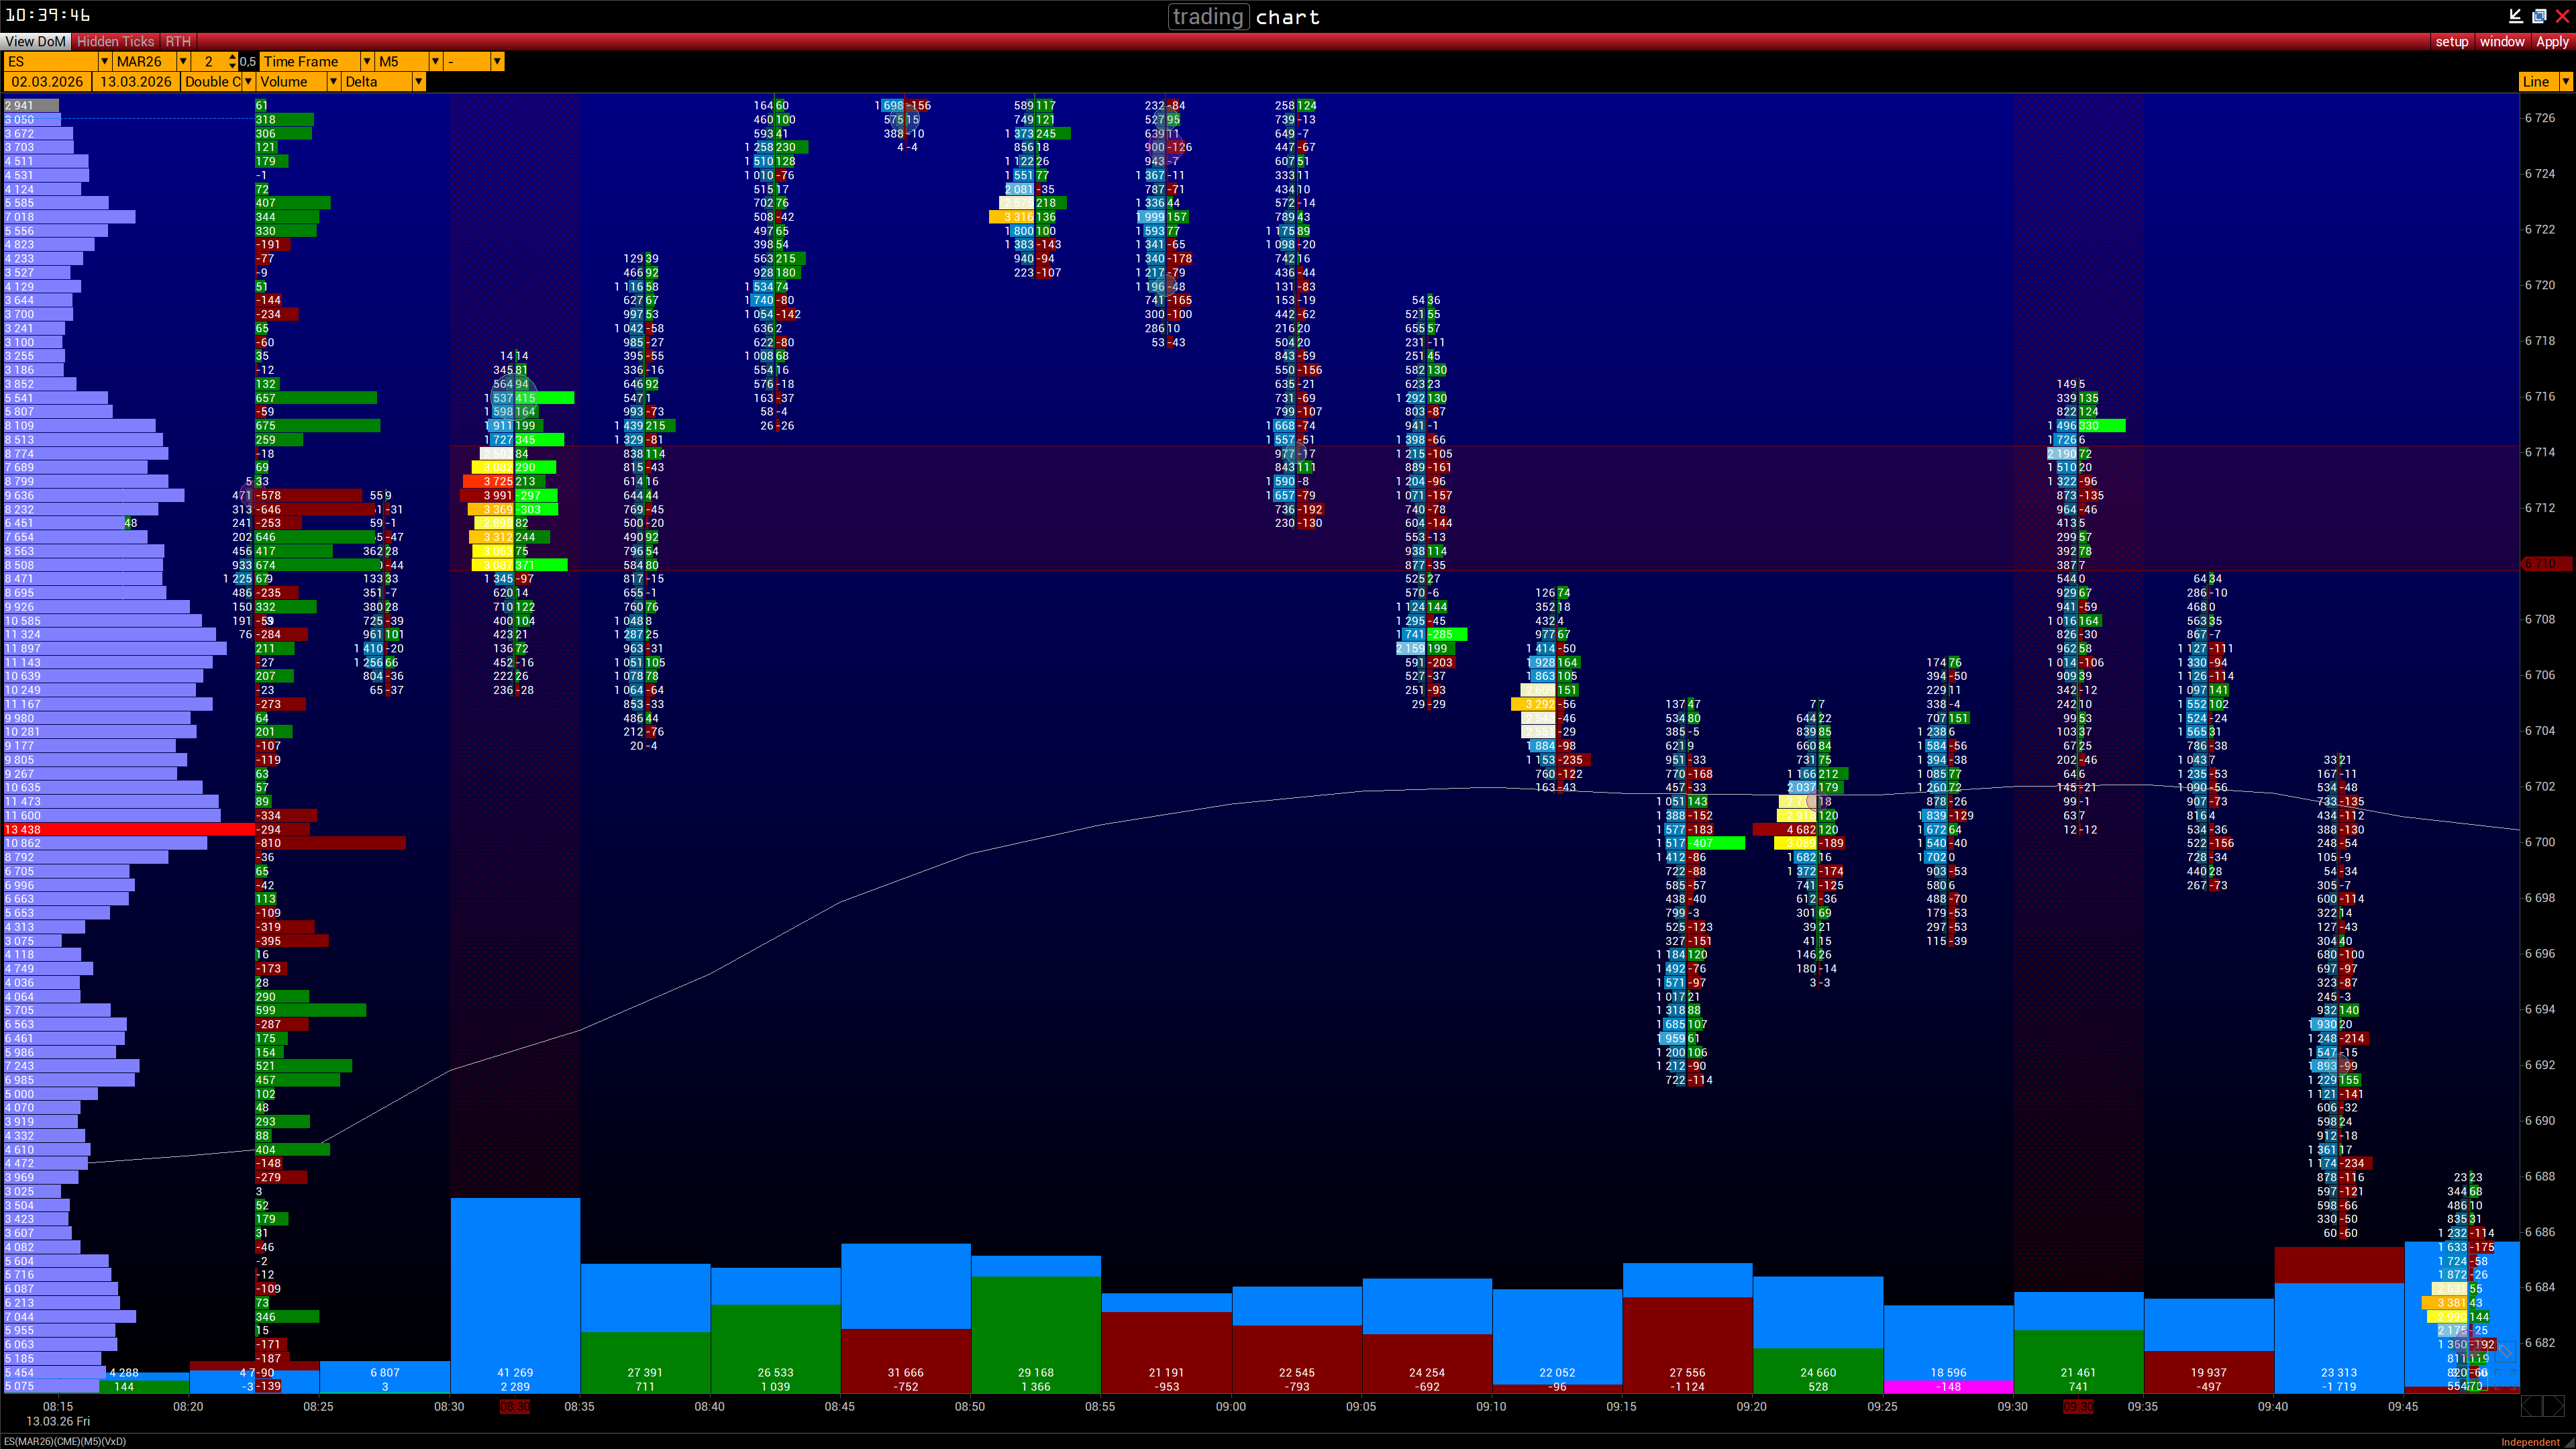
Cluster and Footprint Charts
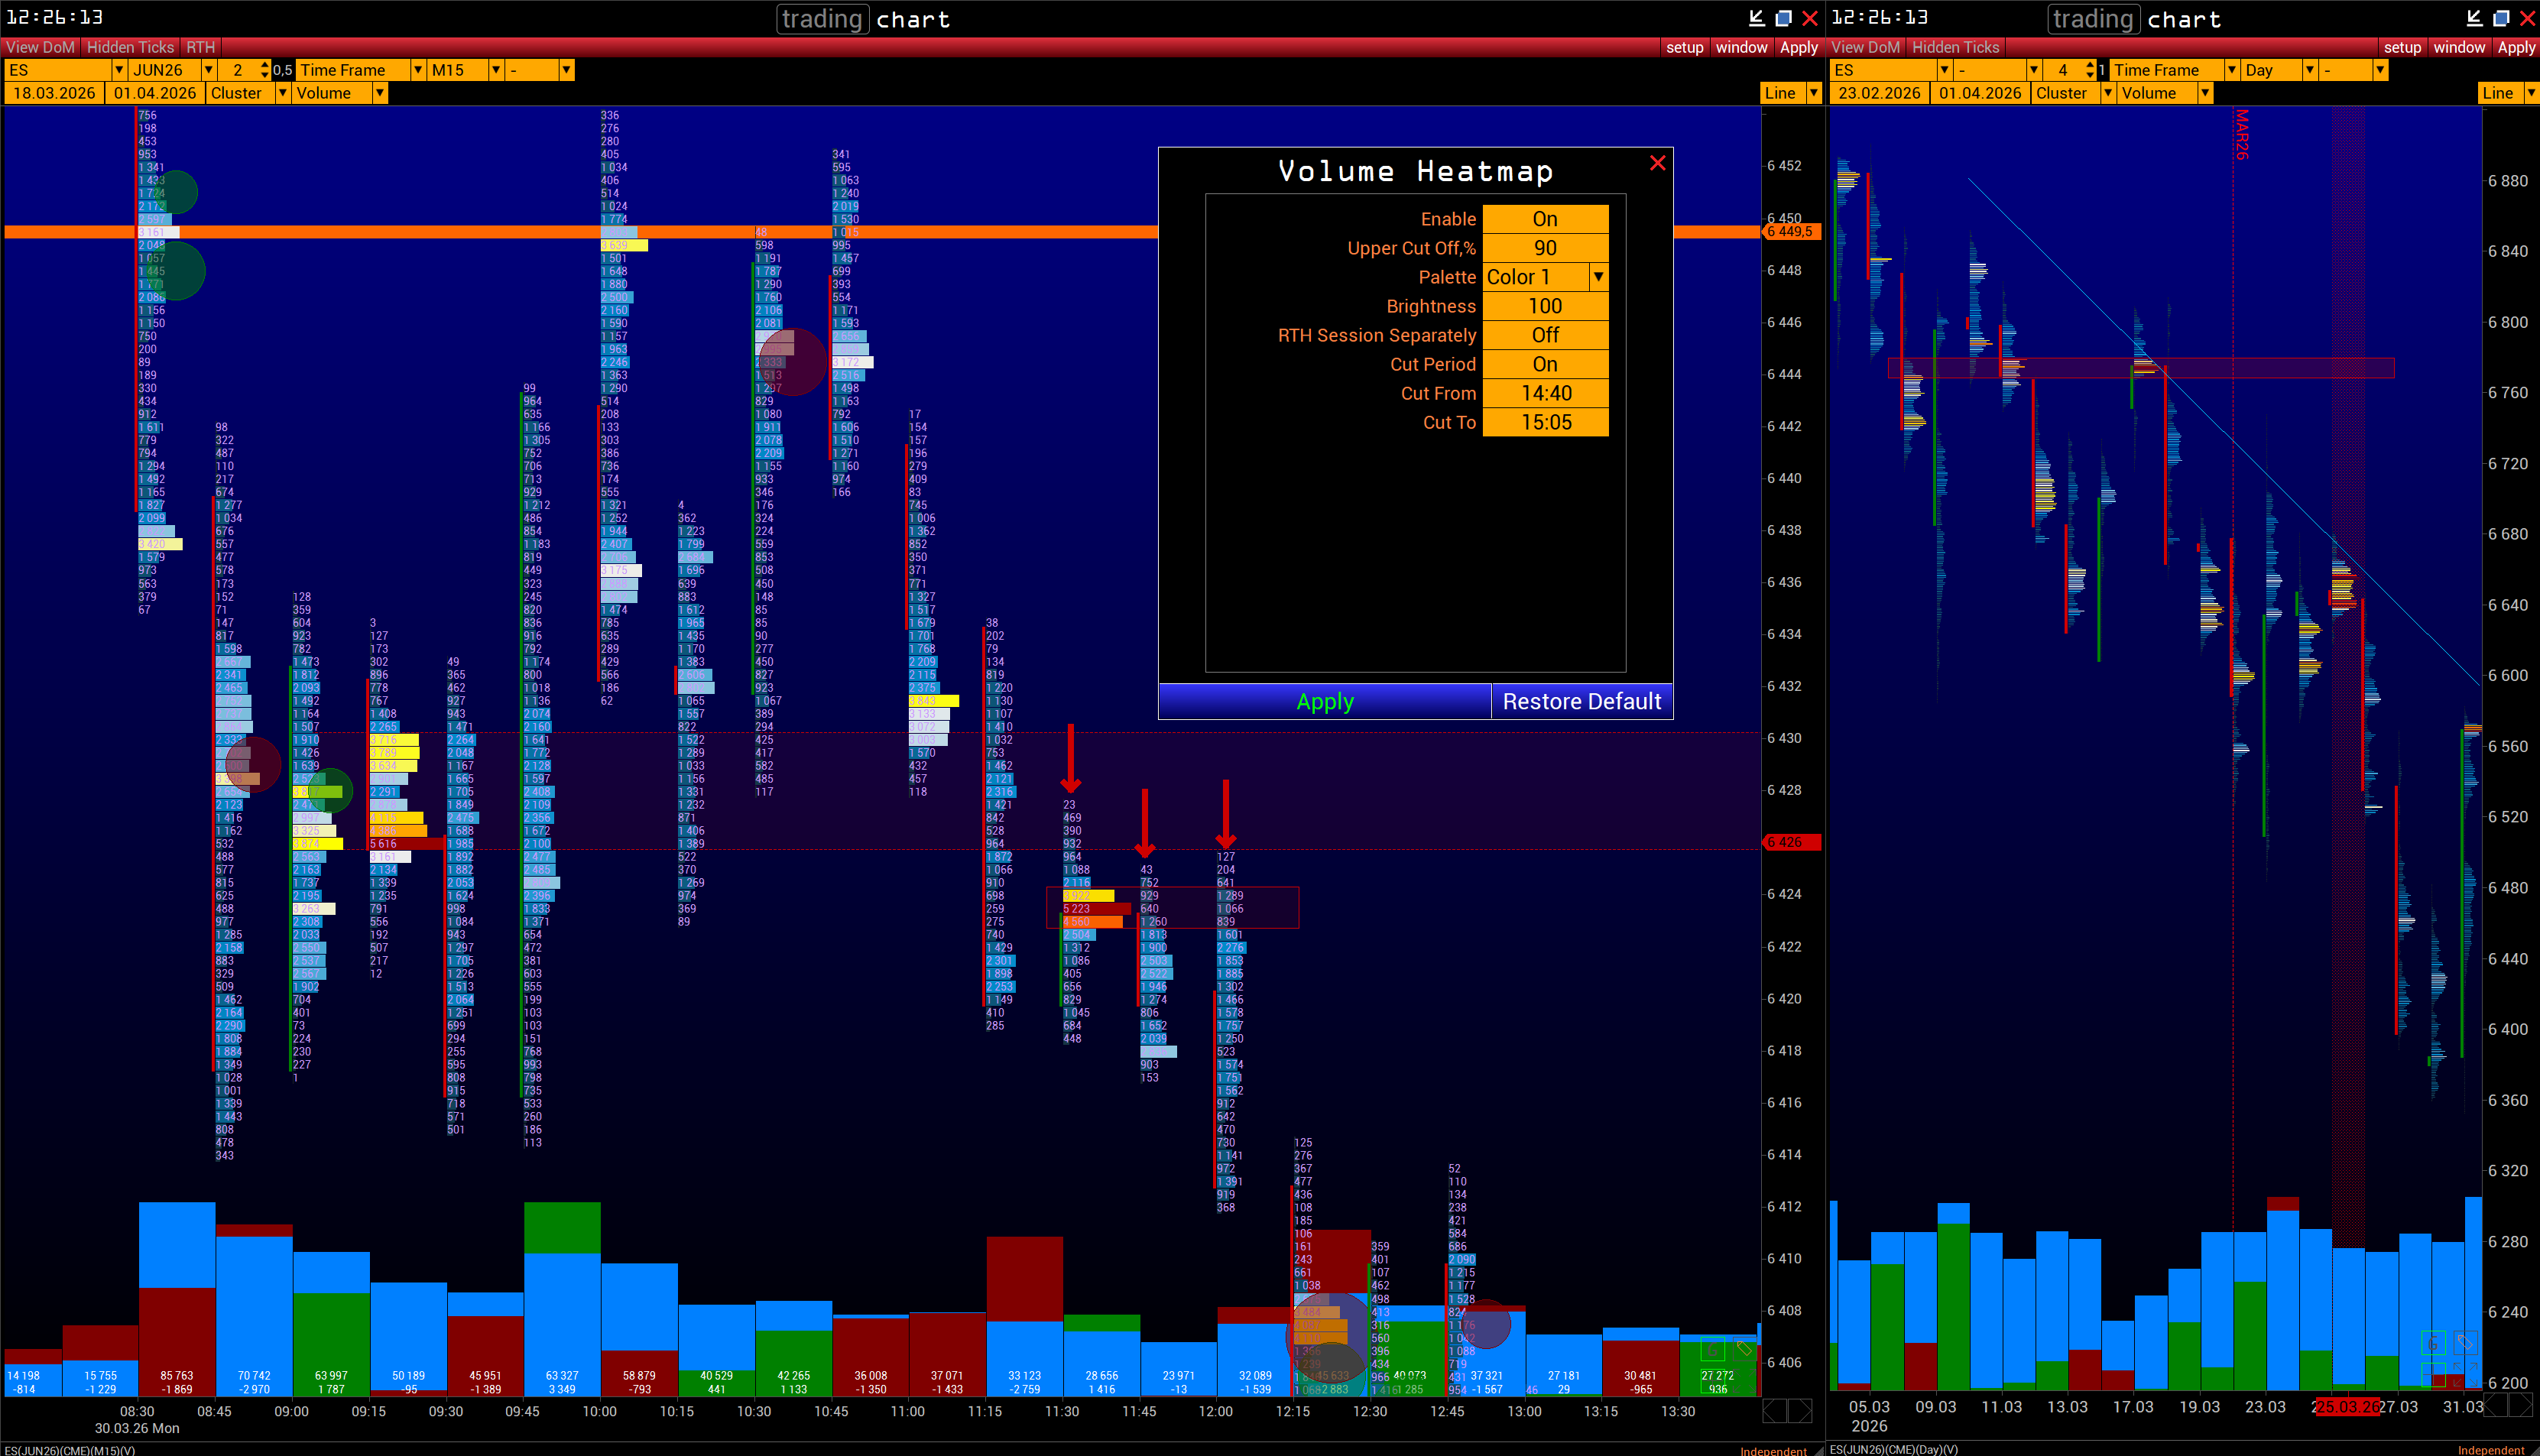
See how volume was distributed at individual price levels. Compare buying and selling pressure and examine the structure hidden behind a conventional chart.
Not just where price moved.
What happened as it moved.
Chapter 04 / The toolset
01
Recognise significant activity
VolFix detects and aggregates related aggressive executions, presenting fragmented activity as a clearer consolidated structure.
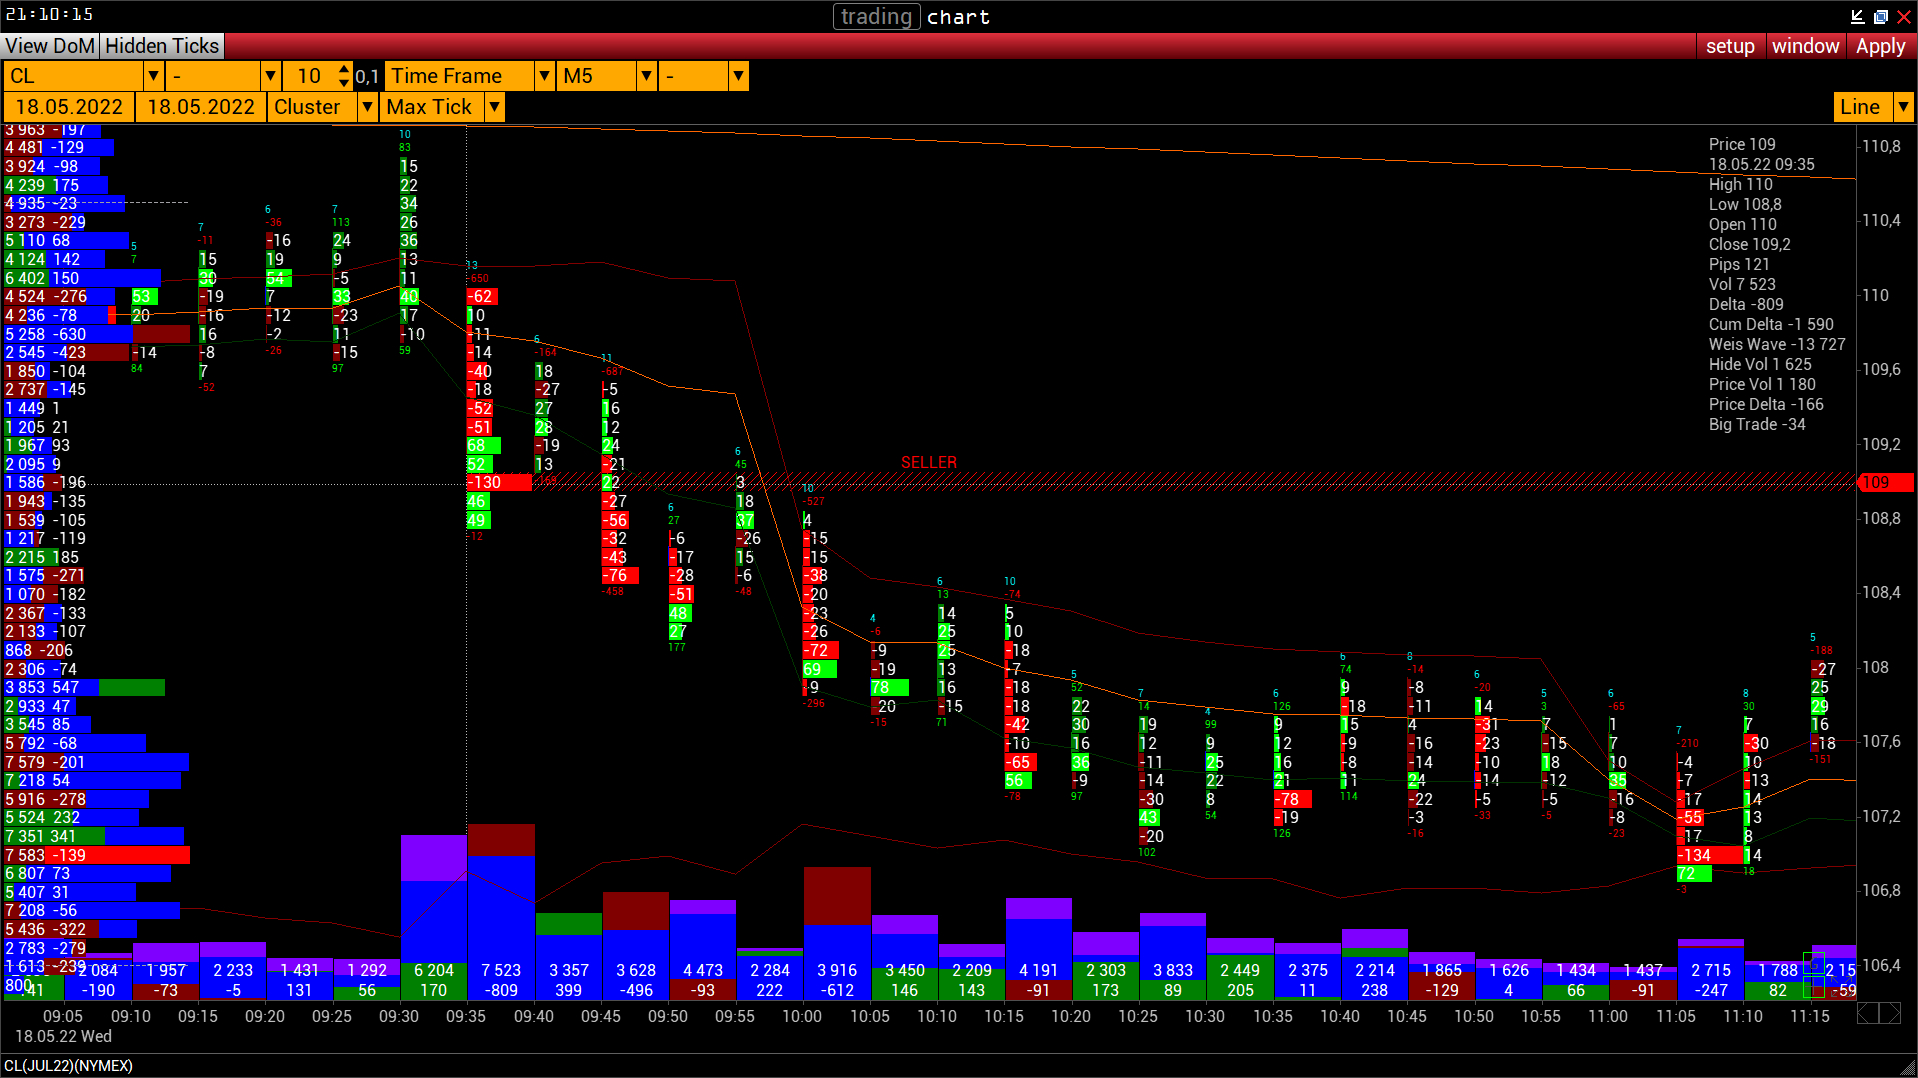
02
Turn volume into market structure
Colour-based analysis brings attention to heavy participation, potential support and resistance and shifts in the balance between buyers and sellers.
03
Analyse and act from one workspace
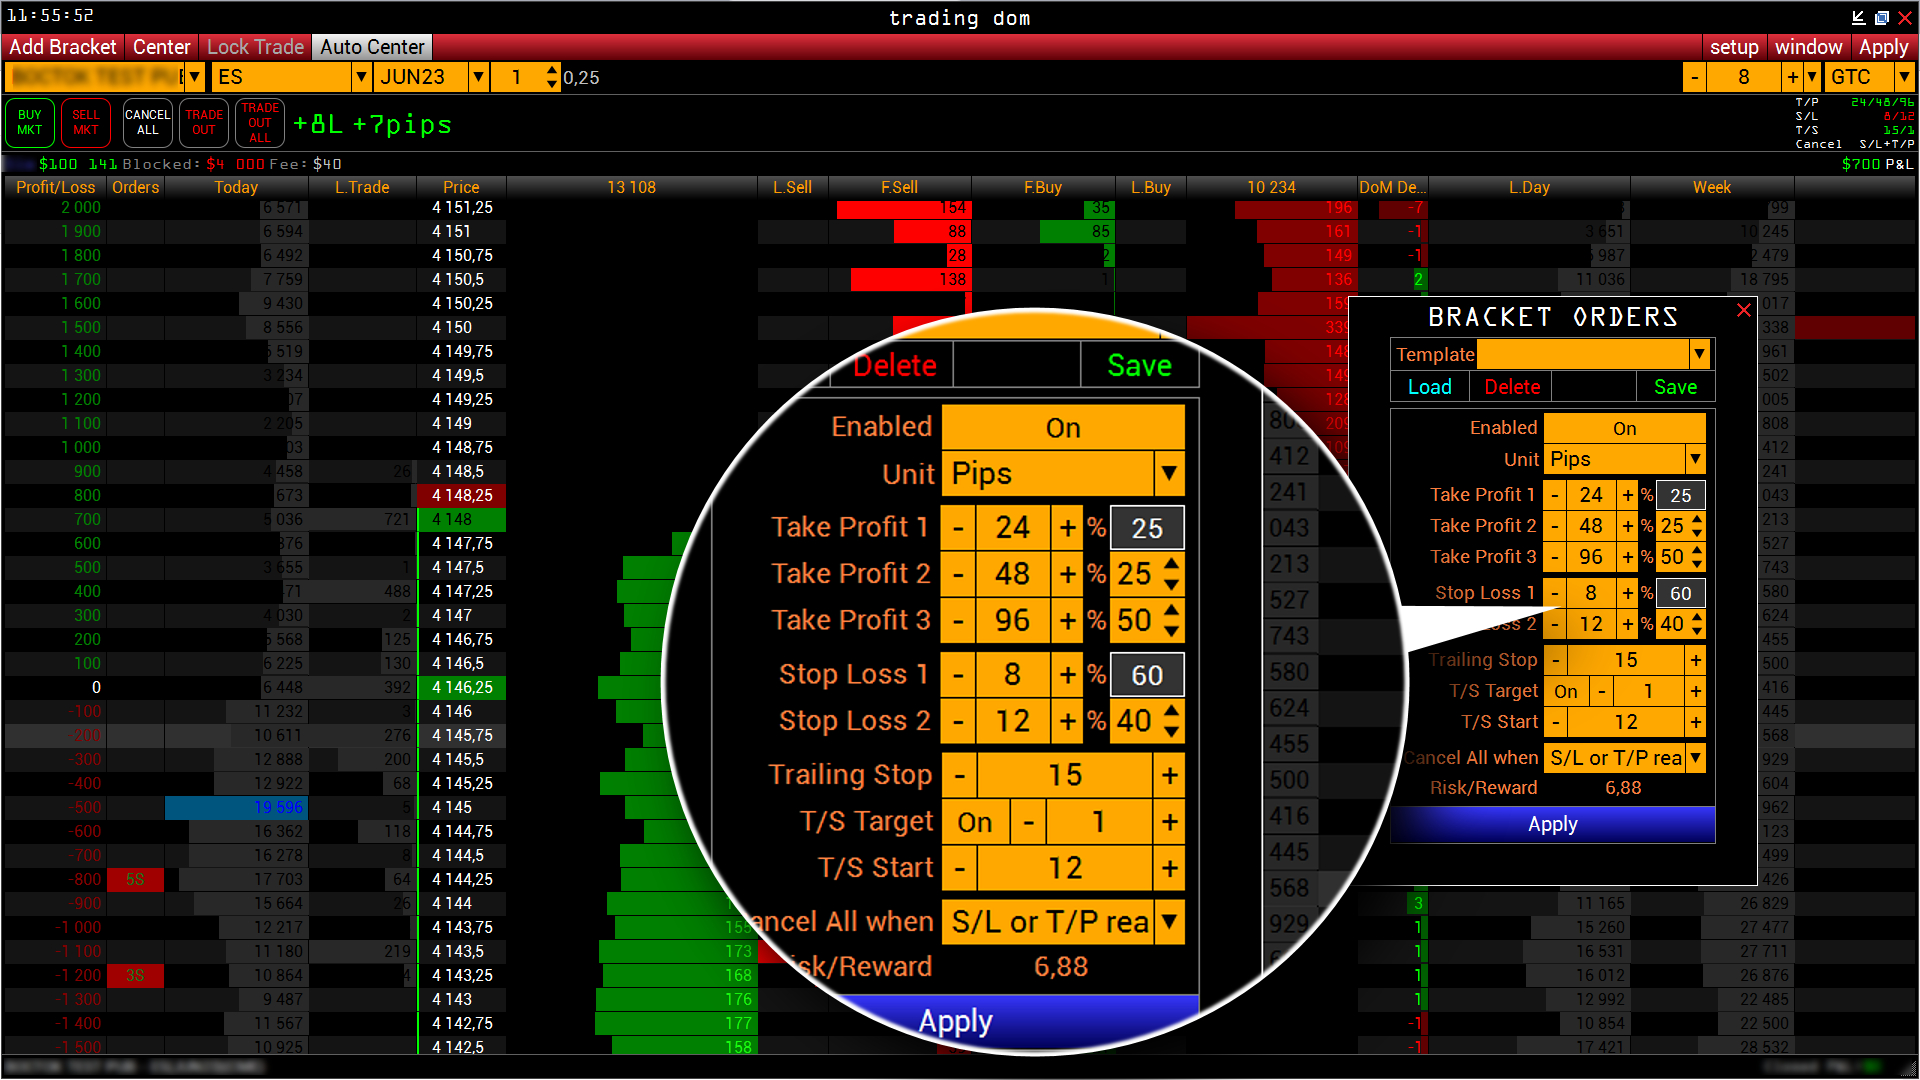
Study market depth, monitor liquidity and manage orders in one interactive window built for active intraday and scalping workflows.
Built for real trading workspaces
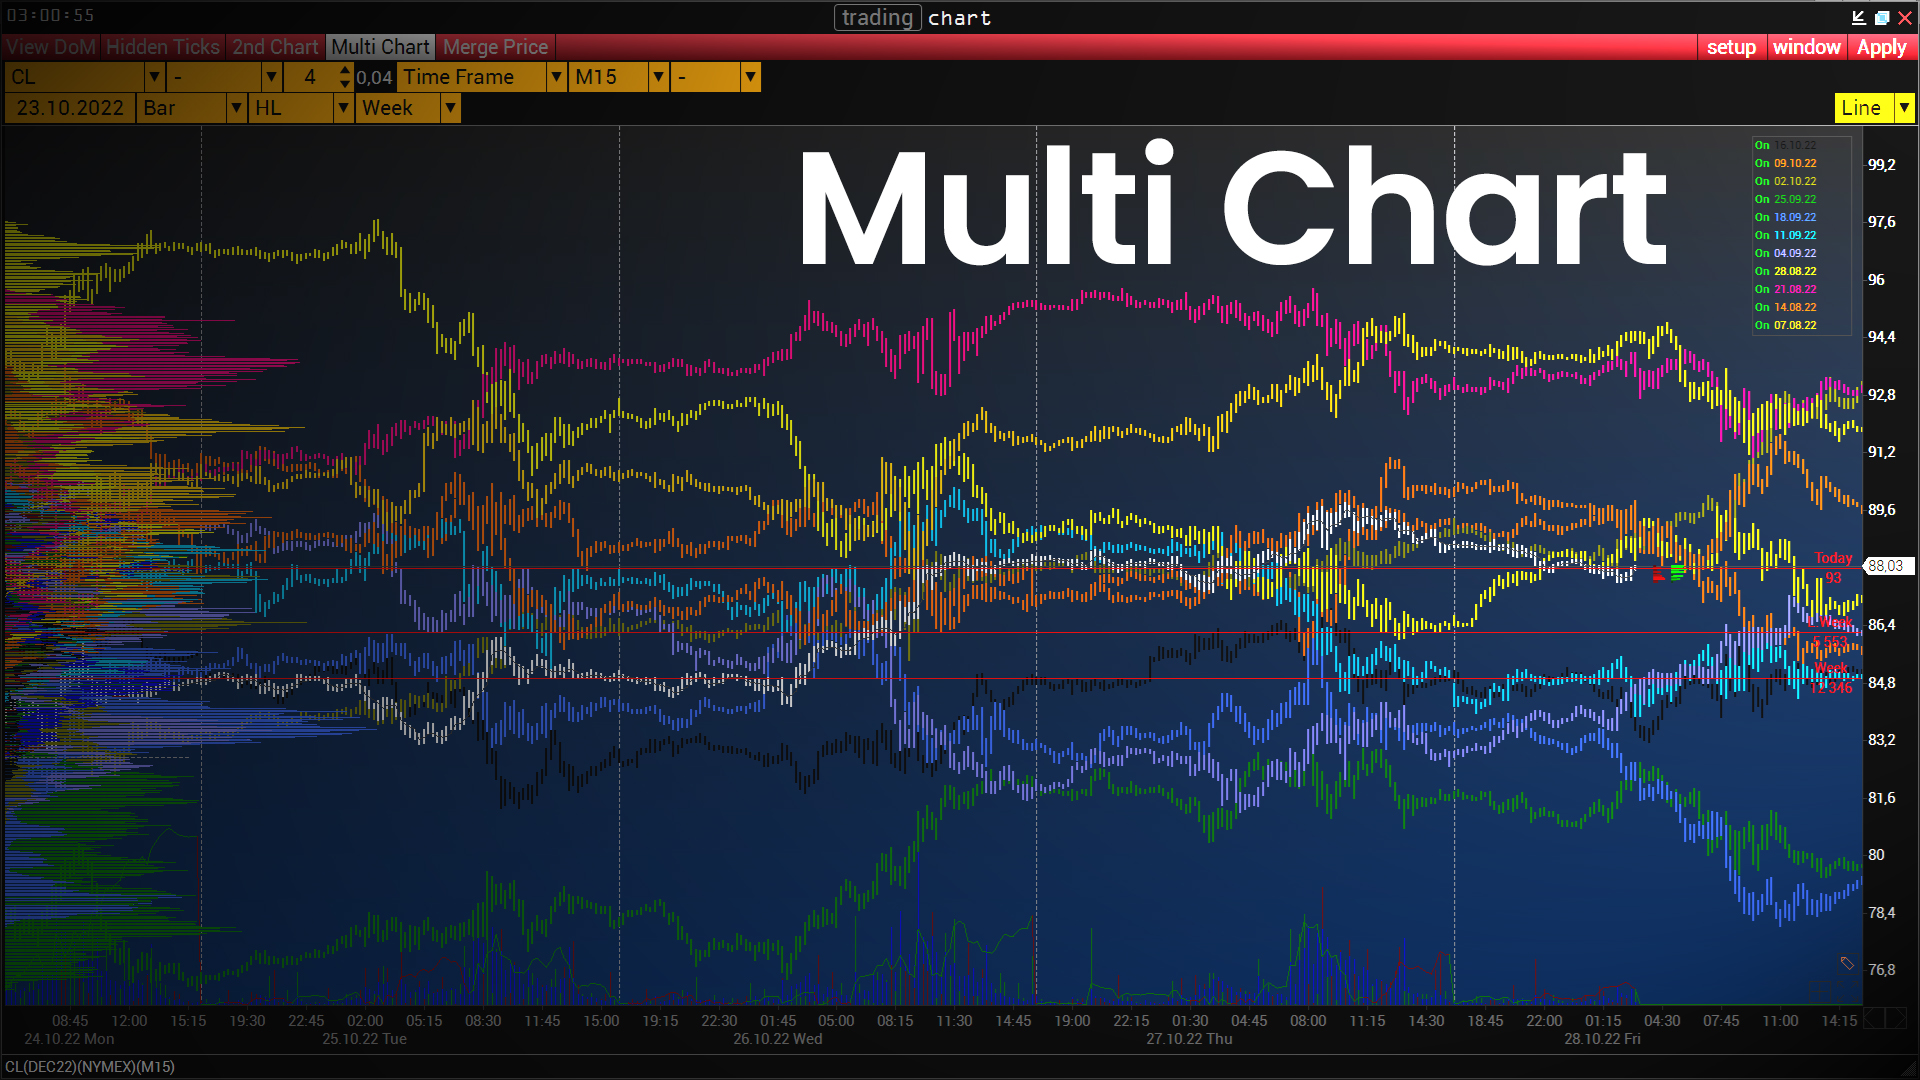
Whether you work from one screen or an entire trading desk, VolFix is built to keep critical market information accessible.
Return to the moment
Replay historical market data tick by tick. Pause it, rewind it or increase the speed. Review a session, practise decision-making and manually test an idea against real historical market behaviour.
The session may be over.
The lesson does not have to be.
The complete environment
Clusters. Footprints. Tick charts. Heatmaps. Trading DOM. Big Trades. Market Replay. Advanced order-flow analysis.
The complete analytical environment is available from the beginning. Packages are based on supported markets and license duration—not progressively restricted feature tiers.
Historical context
VolFix provides historical volume data dating back to 2008, with tick-level historical data available from 2016 for Market Replay and manual strategy testing.
Study previous sessions. Revisit volatility. Examine how the market behaved around specific events.
Chapter 05 / The community
When VolFix began in 2006, the purpose was simple: help traders understand the activity behind price.
Twenty years later, the technology has evolved, but the principle remains unchanged: the clearer you can see the market, the better you can study your decisions.
To every trader who opened a chart, replayed a session, tested an idea or helped us improve—thank you.
Chapter 06 / VolFix Academy

As VolFix evolved, its work expanded beyond software. VolFix Academy translated the platform's volume-analysis methods into structured learning built around real tools and market examples.
The focus is practical: connect market theory with what the platform reveals, revisit historical sessions and apply each concept through guided analysis.
Chapter 07 / Next chapter
New users50% off a 3-month VolFix license
Everyone25% off any other VolFix plan
20 years behind us. The next market is ahead.