Market Pulse ///
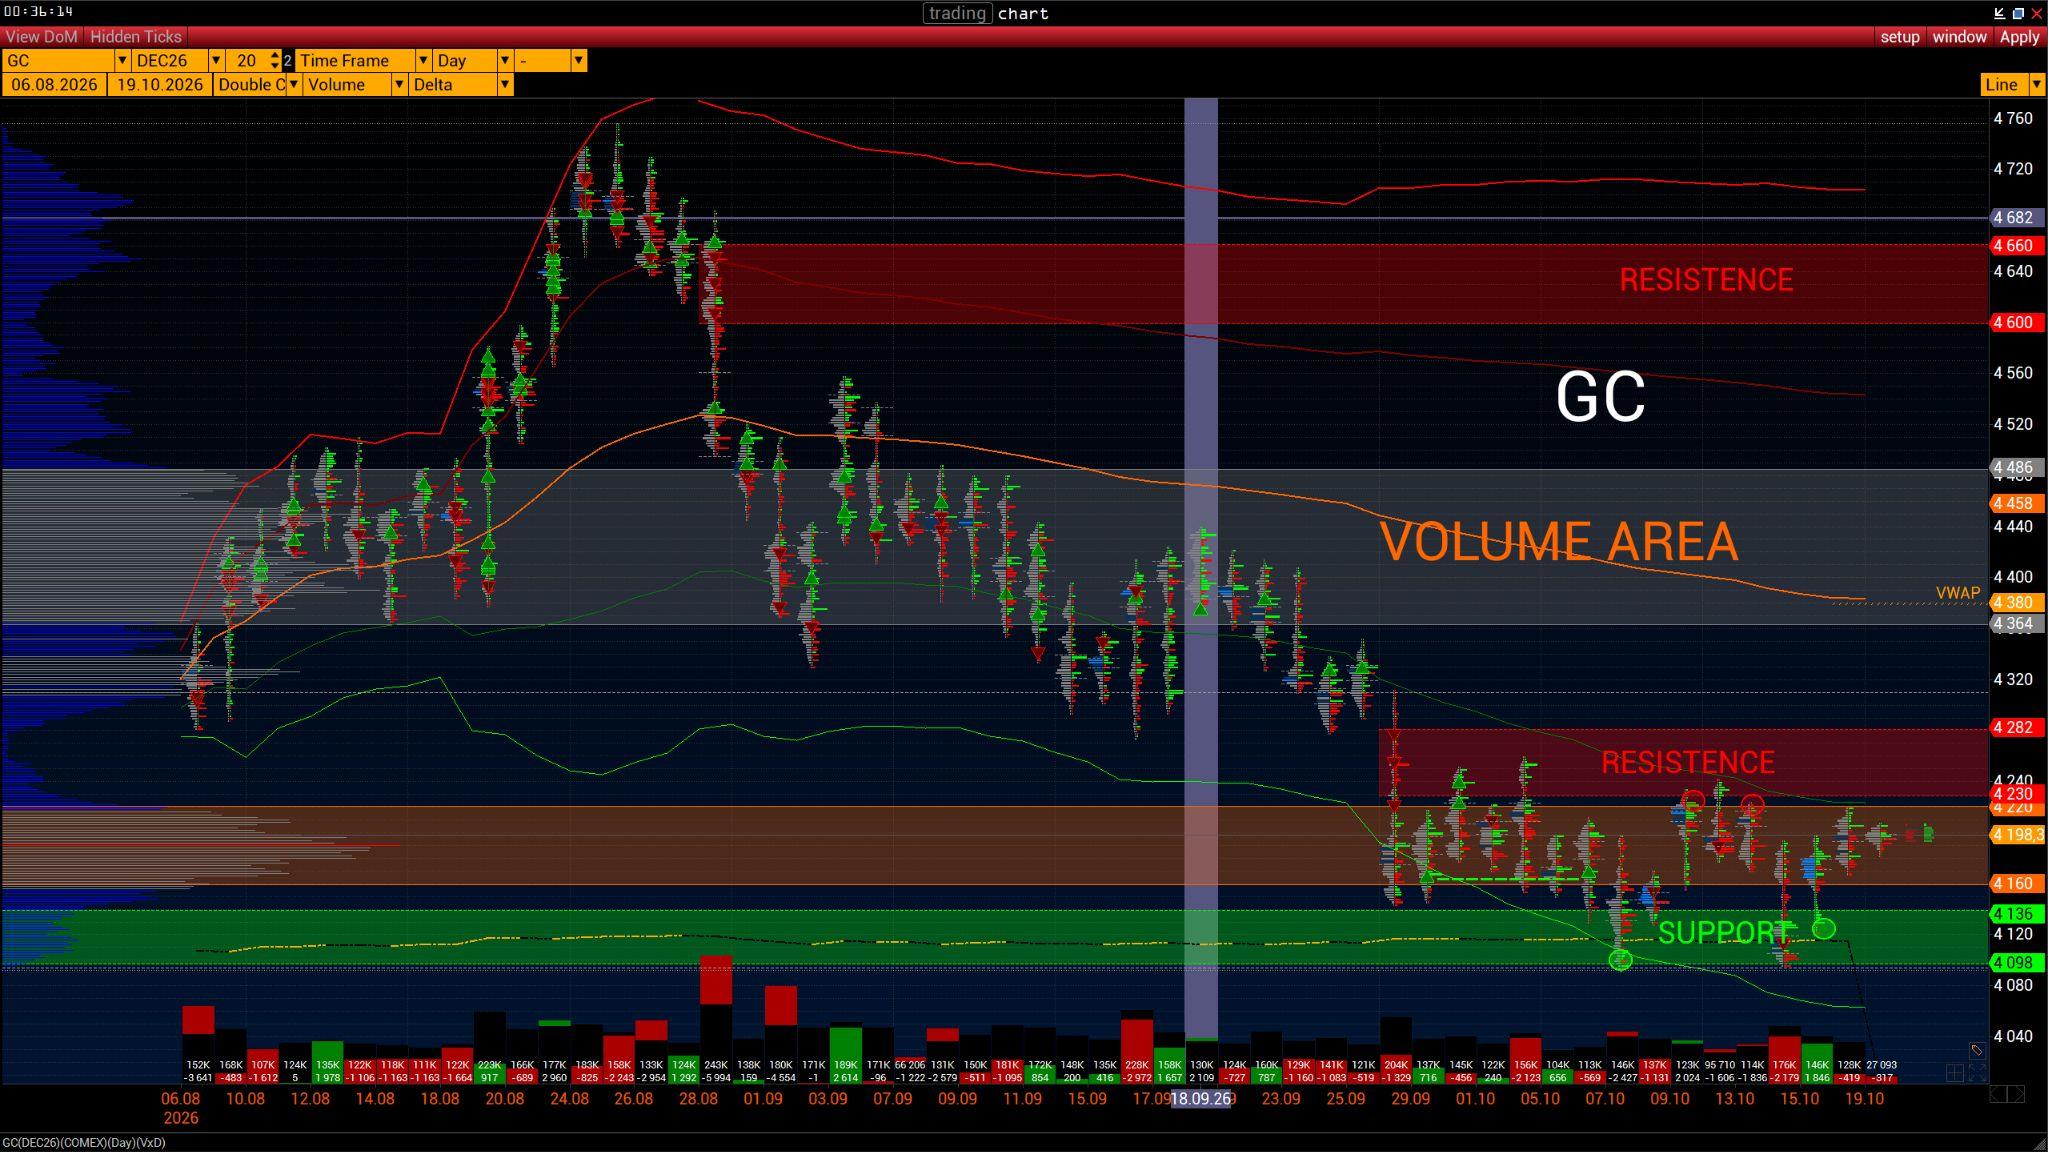
Key volume levels for the current week.
The December gold futures contract has finished trading. Traders have started trading the new contract, but the key levels from the old contract need to be taken into account for a more objective analysis.
If we divide the contract into weekly segments and identify each week’s trend, only 2 of the 10 weeks had an upward trend, 5 weeks had a downward trend, and the remaining weeks were range-bound. Overall, sellers controlled the price over the life of the contract.
The main liquidity is concentrated in the 4364–4486 range — Volume Area. This range can be treated as resistance during the first few weeks of the new contract.
VWAP Indicator Price — 4380
During the final trading days before expiration, prices traded close to the VWAP Deviation -1 level. This is clearly attracting buyers, as can already be seen from buyer activity and the imbalance readings of Total Delta.
Resistance lies at 4600–4660. The 4230–4282 range is also marked as resistance, but it was formed by large trades during an impulsive move and does not represent an accumulation of liquidity, so it should be treated as short-term resistance.
Support in the 4098–4136 range has already held twice. The volume cluster at 4160–4220 can be treated as support once buyers manage to push the price per troy ounce of gold above the nearest resistance range of 4230–4282.
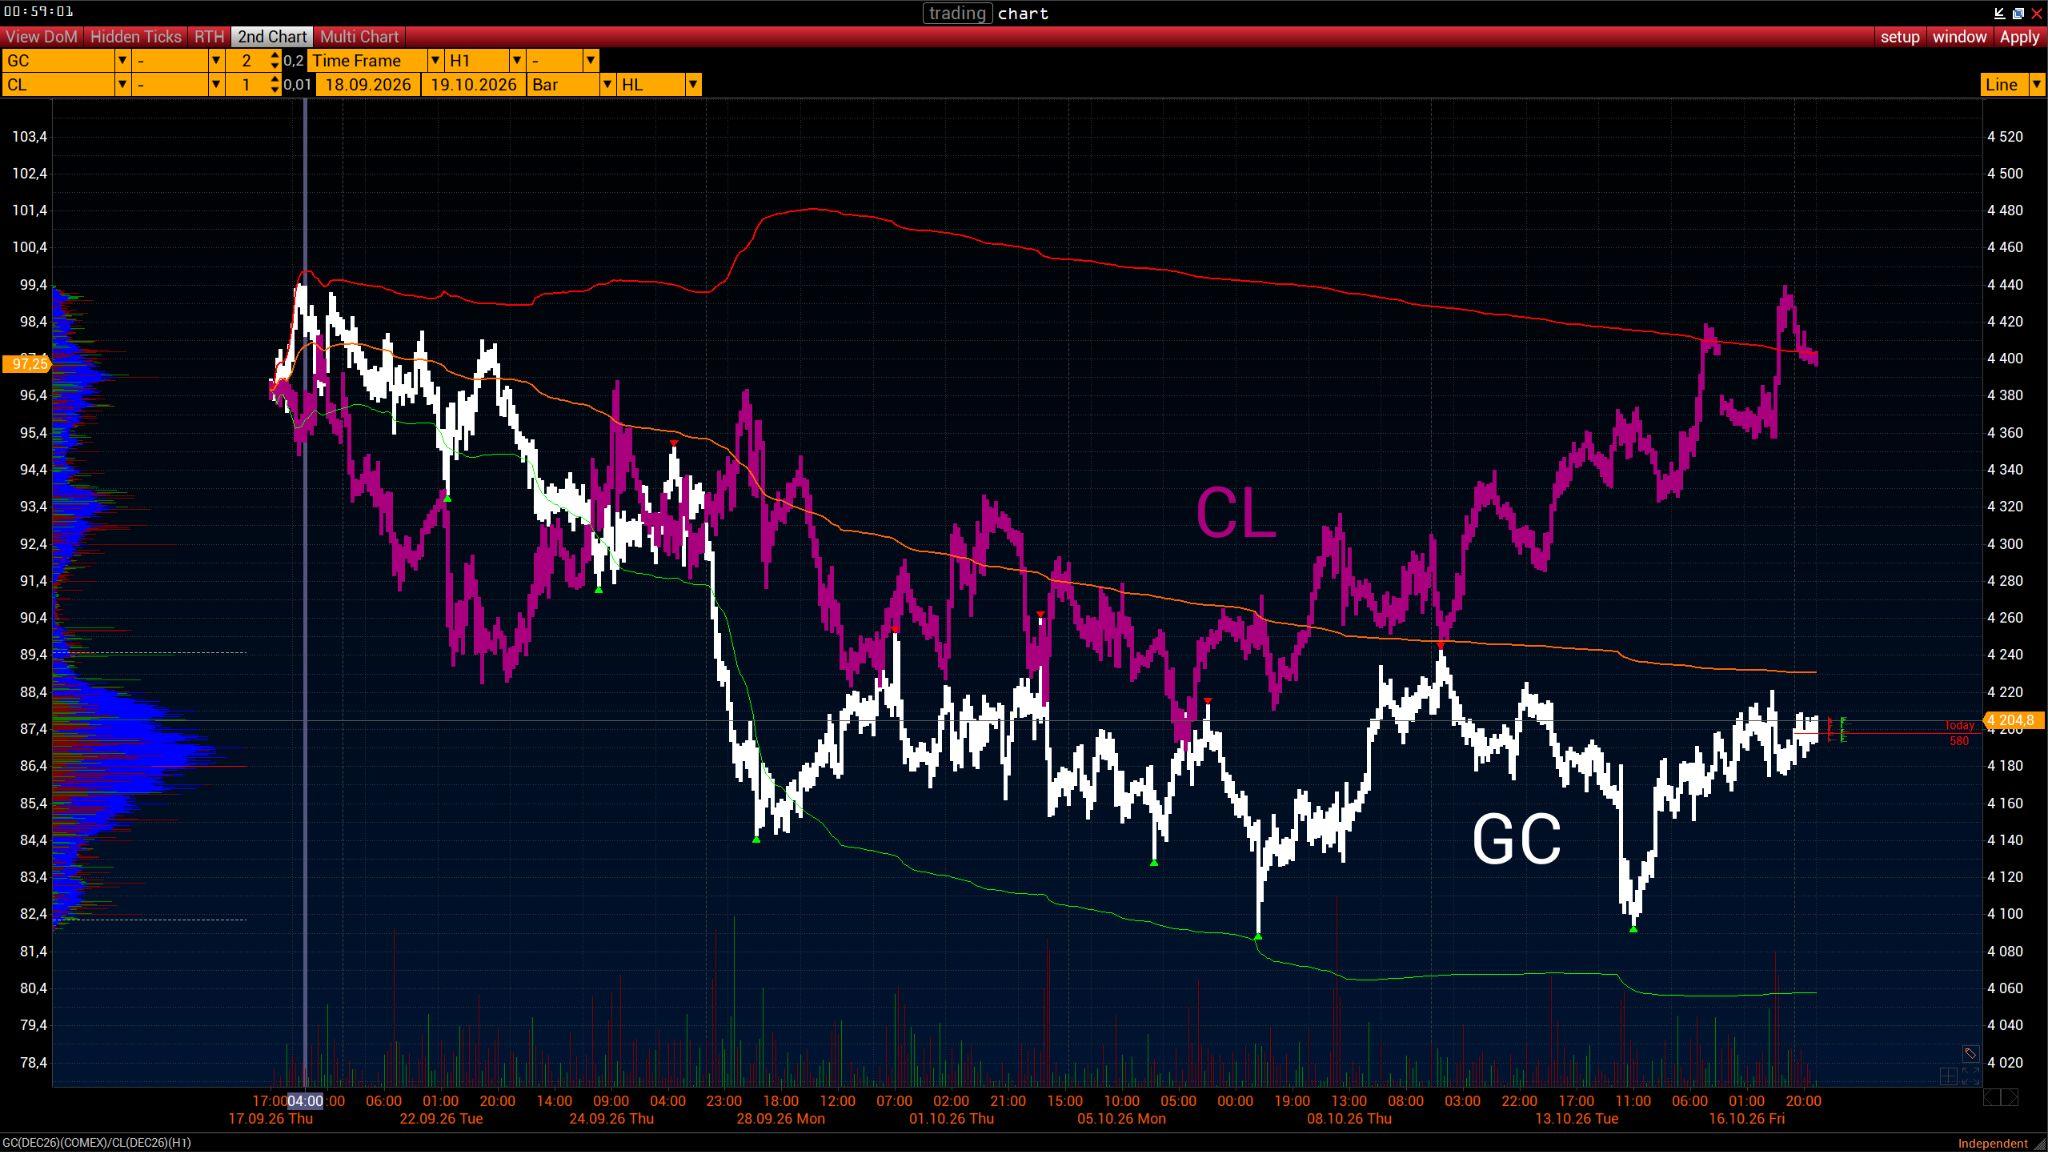
The price of a barrel of oil affects the price of gold — keep this in mind. Look at the correlation between their prices on the chart.